Fig. D.1
Download original image
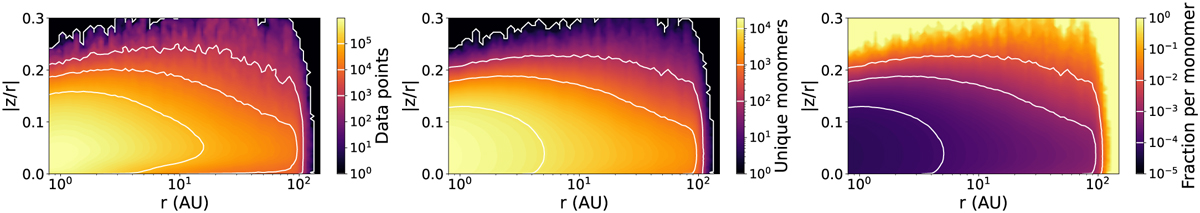
Distribution of the monomer population over the background model grid. Left panel: Spatial distribution of the number of timesteps (data points) per spatial grid cell, based on a simulation of 64000 monomers. Center panel: Number of unique monomers that have visited a given cell during their evolutionary trajectories. Right panel: The average fraction of grid cell data points contributed by a single unique monomer.
Current usage metrics show cumulative count of Article Views (full-text article views including HTML views, PDF and ePub downloads, according to the available data) and Abstracts Views on Vision4Press platform.
Data correspond to usage on the plateform after 2015. The current usage metrics is available 48-96 hours after online publication and is updated daily on week days.
Initial download of the metrics may take a while.