Fig. 6
Download original image
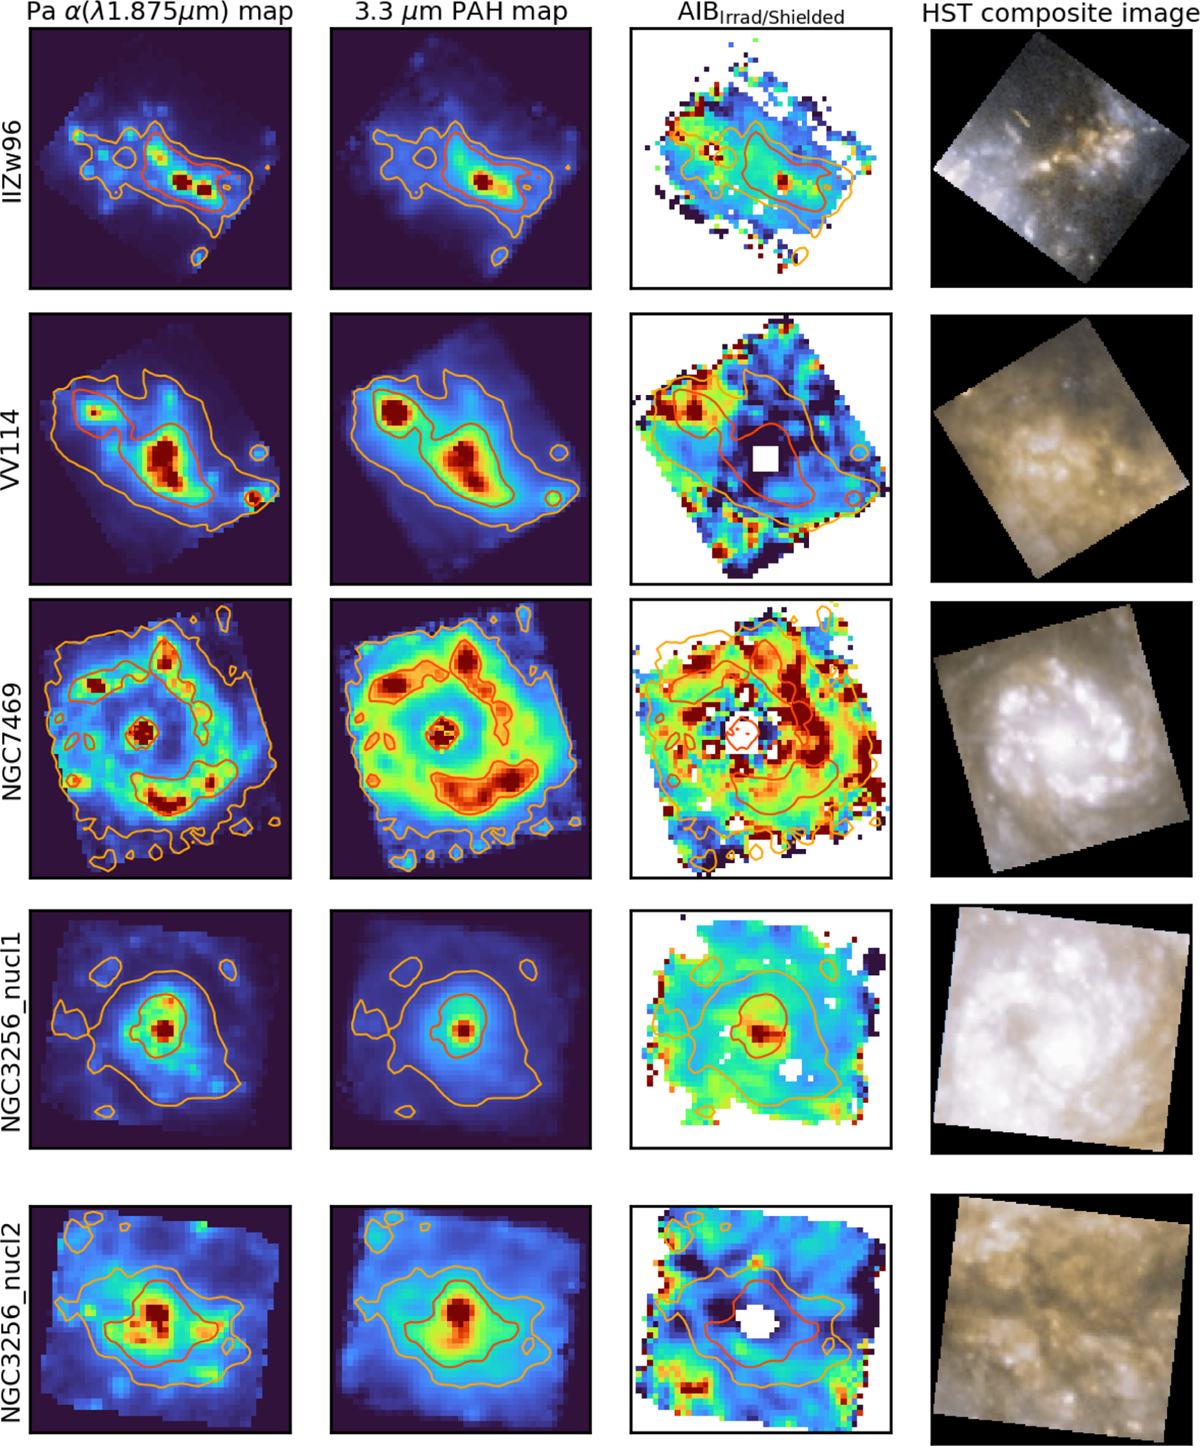
GOALS-JWST galaxies emission maps and their AIBIrrad/Shielded spatial distribution. First column: NIRSpec continuum-subtracted Paschen α emission maps. Second column: NIRSpec continuum-subtracted 3.3 μm emission maps with intensity contours. The contours are shown in each panel for each galaxy for better comparison. Third column; AIBIrrad/Shielded contribution maps for each galaxy. In this column, saturated spaxels are represented in white. We note that we do not take into account edge spaxels as they are too noisy and mostly contain artifacts. Last column: Hubble Space Telescope color composite images (F435W and F814W filters) of each galaxy.
Current usage metrics show cumulative count of Article Views (full-text article views including HTML views, PDF and ePub downloads, according to the available data) and Abstracts Views on Vision4Press platform.
Data correspond to usage on the plateform after 2015. The current usage metrics is available 48-96 hours after online publication and is updated daily on week days.
Initial download of the metrics may take a while.