Fig. 4
Download original image
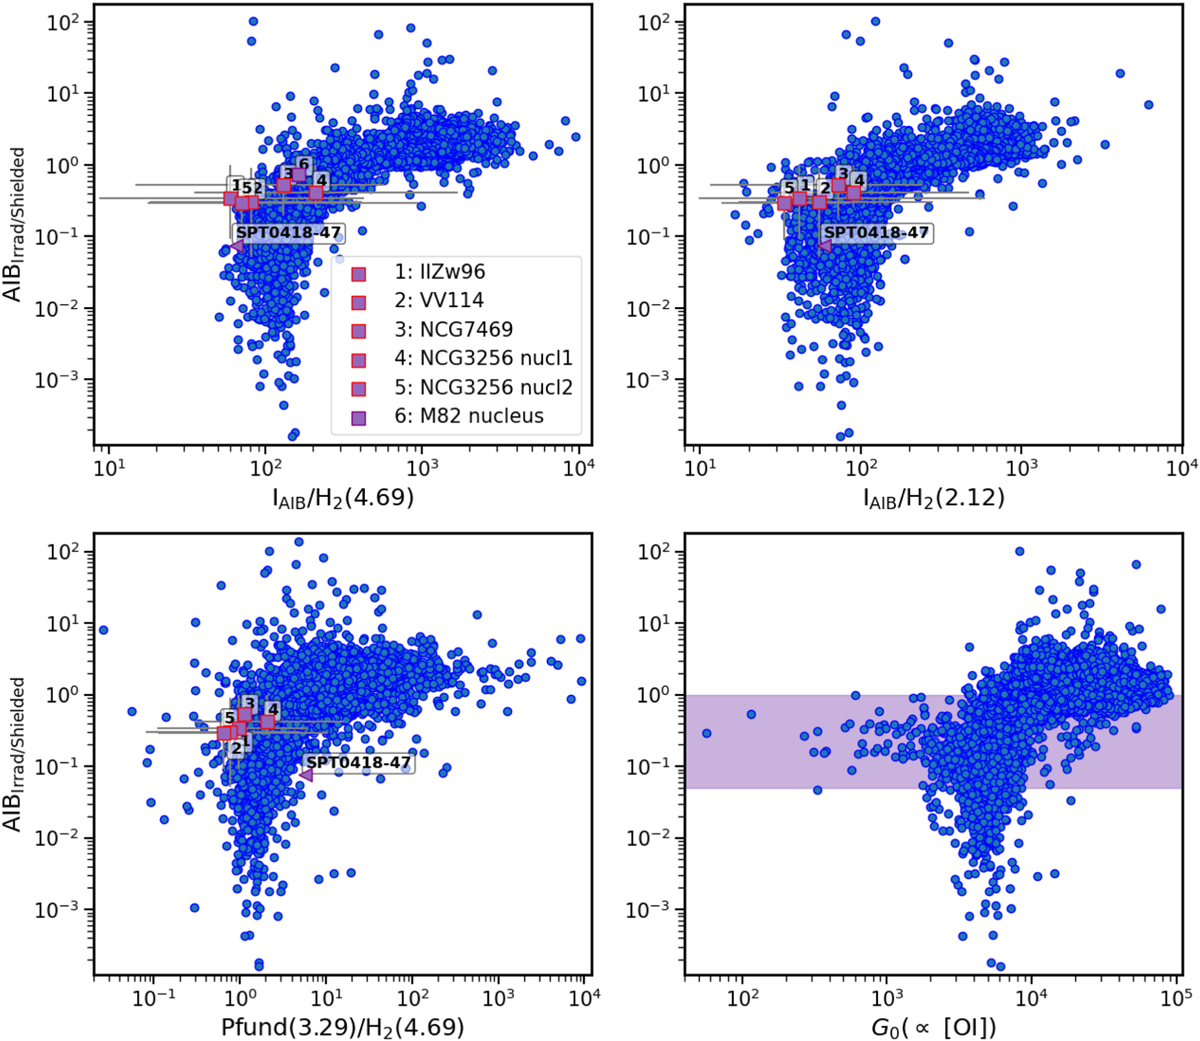
AIBIrrad/Shielded as function of IAIB/H2 flux ratio for the rotational H2 0–0 S(9) emission line at λ ≈ 4.69 μm (top left panel) and the ro-vibrational H2 1–0 S(1) emission line at λ ≈ 2.12 μm (top-right panel). We note that for M82, we only have access to H2(4.69) as there is no observation available of H2(2.12) emission line in NIRSpec yet. The bottom row shows the same ratio as a function of Pfund(λ ≈ 3.29 μm)/H2(λ ≈ 4.69 μm) in the left panel and of G0 in the right panel. For G0, in purple, we indicate the area of AIBIrrad/Shielded corresponding to galaxies. For all panels, blue circles are the Orion Bar NIRSpec values for each spaxel. Purple squares represent the positions of the galaxies studied in these diagrams. Spatially resolved galaxies are represented with a red edge and have error bars corresponding to 1 σ percentiles (5% and 95% of fit values for all galaxy spaxels). For these points, the median values of all the fits are shown.
Current usage metrics show cumulative count of Article Views (full-text article views including HTML views, PDF and ePub downloads, according to the available data) and Abstracts Views on Vision4Press platform.
Data correspond to usage on the plateform after 2015. The current usage metrics is available 48-96 hours after online publication and is updated daily on week days.
Initial download of the metrics may take a while.