Fig. 2
Download original image
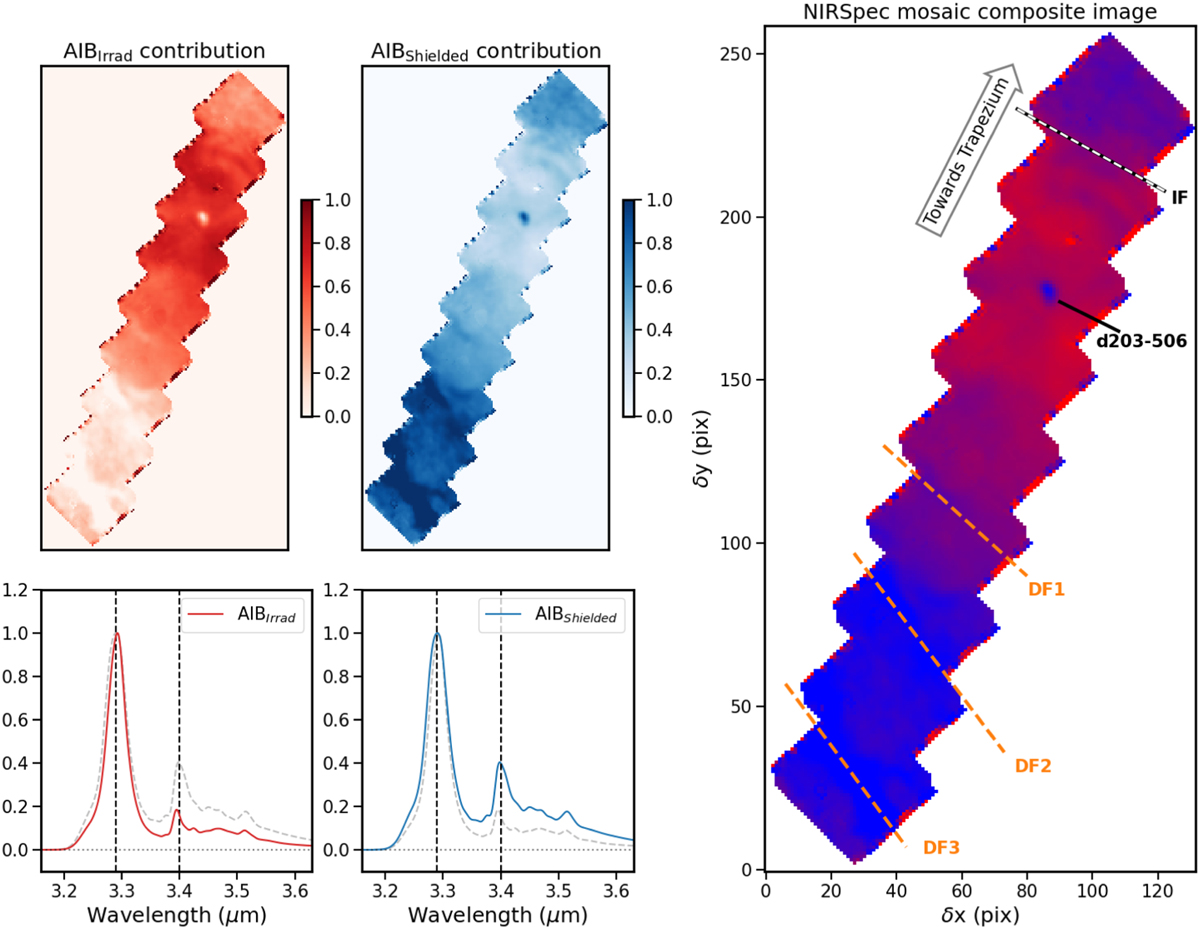
Presentation and distribution of the two extracted template spectra. Left column : AIBIrrad map on top and the corresponding normalized template spectrum of the AIBIrrad component. Middle column: same as left column, but for the AIBShieided template. We note that AIBIrrad has a more prominent 3.3 μm band (and a slightly redder peak) than AIBShielded, which has a stronger 3.4 μm band. For a quick comparison between both templates, on each bottom panel, the complementary template is shown in dashed gray lines. Right column: composite image of both AIBIrrad (red) and AIBShielded (blue) contributions. The ionization front (IF) and the dissociation fronts (DF1, 2, and 3) are represented by dashed white and orange lines, respectively (defined in Habart et al. 2024 and Peeters et al. 2024).
Current usage metrics show cumulative count of Article Views (full-text article views including HTML views, PDF and ePub downloads, according to the available data) and Abstracts Views on Vision4Press platform.
Data correspond to usage on the plateform after 2015. The current usage metrics is available 48-96 hours after online publication and is updated daily on week days.
Initial download of the metrics may take a while.