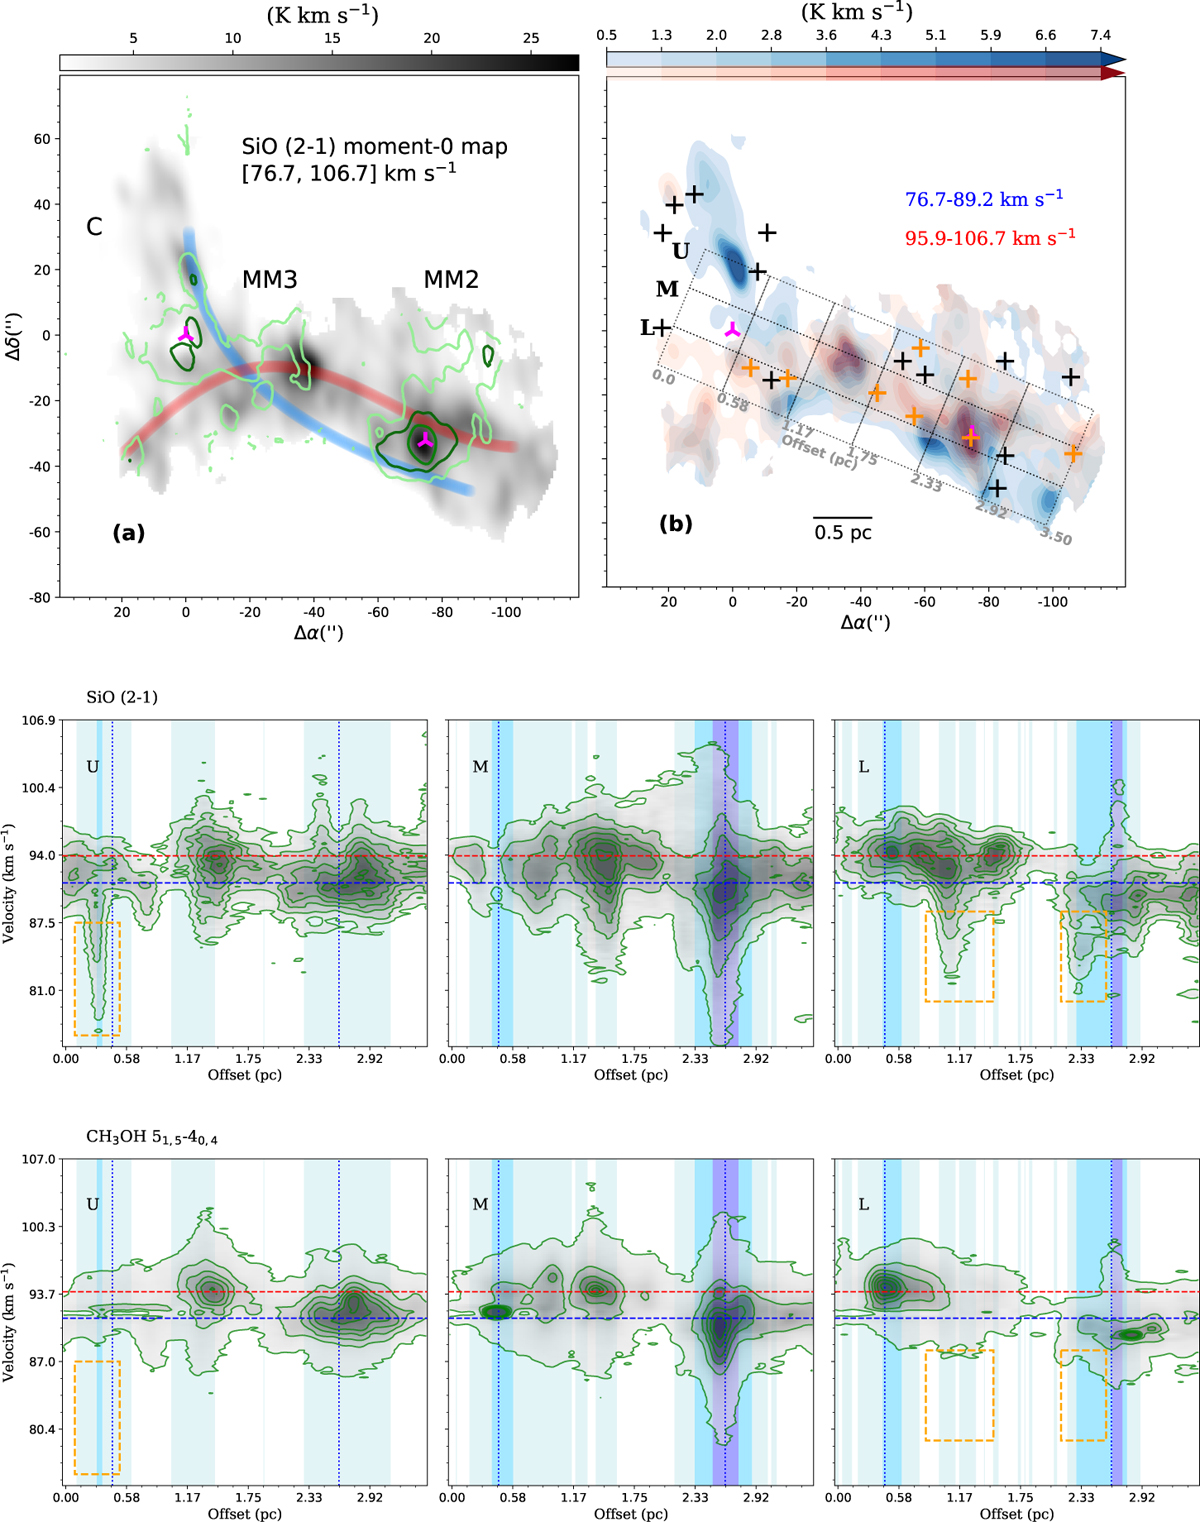
Fig. 9
Download original image
SiO and dense gas distribution and position-velocity maps. Upper panel (a) Integrated intensity map of SiO (21) (76.7–106.7 km s–1, gray scale) overlaid with the n(H2) levels of 106, 1065, 107 cm–3 (in contours of various shades of green, respectively). The 3 mm continuum peaks of MM2 and MM3 are indicated as magenta crosses. The red and blue thick lines indicate the ridge of the emission of the blue-shifted and red-shifted SiO in panel b. (b) The integrated intensity maps (velocity ranges indicated in the plot) of the SiO (2–1) blue-shifted and red-shifted emission. The crosses in orange (with at least one broader velocity component of σv > 0.85 km s–1, see Sect. 4) and black indicate the NH2D cores. For plots a and b, RA and Dec offsets correspond to the relative position with respect to 3 mm continuum peak of MM3. Lower panel: position-velocity diagrams of SiO (2–1) (contour levels of 0.2–1.4K km s–1 with six intervals) and CH3OH 51,5 –40,4 (contour levels of 0.1–10.3 K km s–1 with six intervals) line along the three cuts U, M, and L, as in the upper panel. The colour-shaded regions indicate the n(H2) levels of 106, 1065, and 107 cm–3 (in light blue, blue, and purple). The VLSR of MM2 and MM3 are indicated as red and blue horizontal lines (93.9 km–1 and 91.3 km–1). Blue vertical dotted lines indicate the positions of the 3 mm continuum peak of MM2 and MM3.
Current usage metrics show cumulative count of Article Views (full-text article views including HTML views, PDF and ePub downloads, according to the available data) and Abstracts Views on Vision4Press platform.
Data correspond to usage on the plateform after 2015. The current usage metrics is available 48-96 hours after online publication and is updated daily on week days.
Initial download of the metrics may take a while.