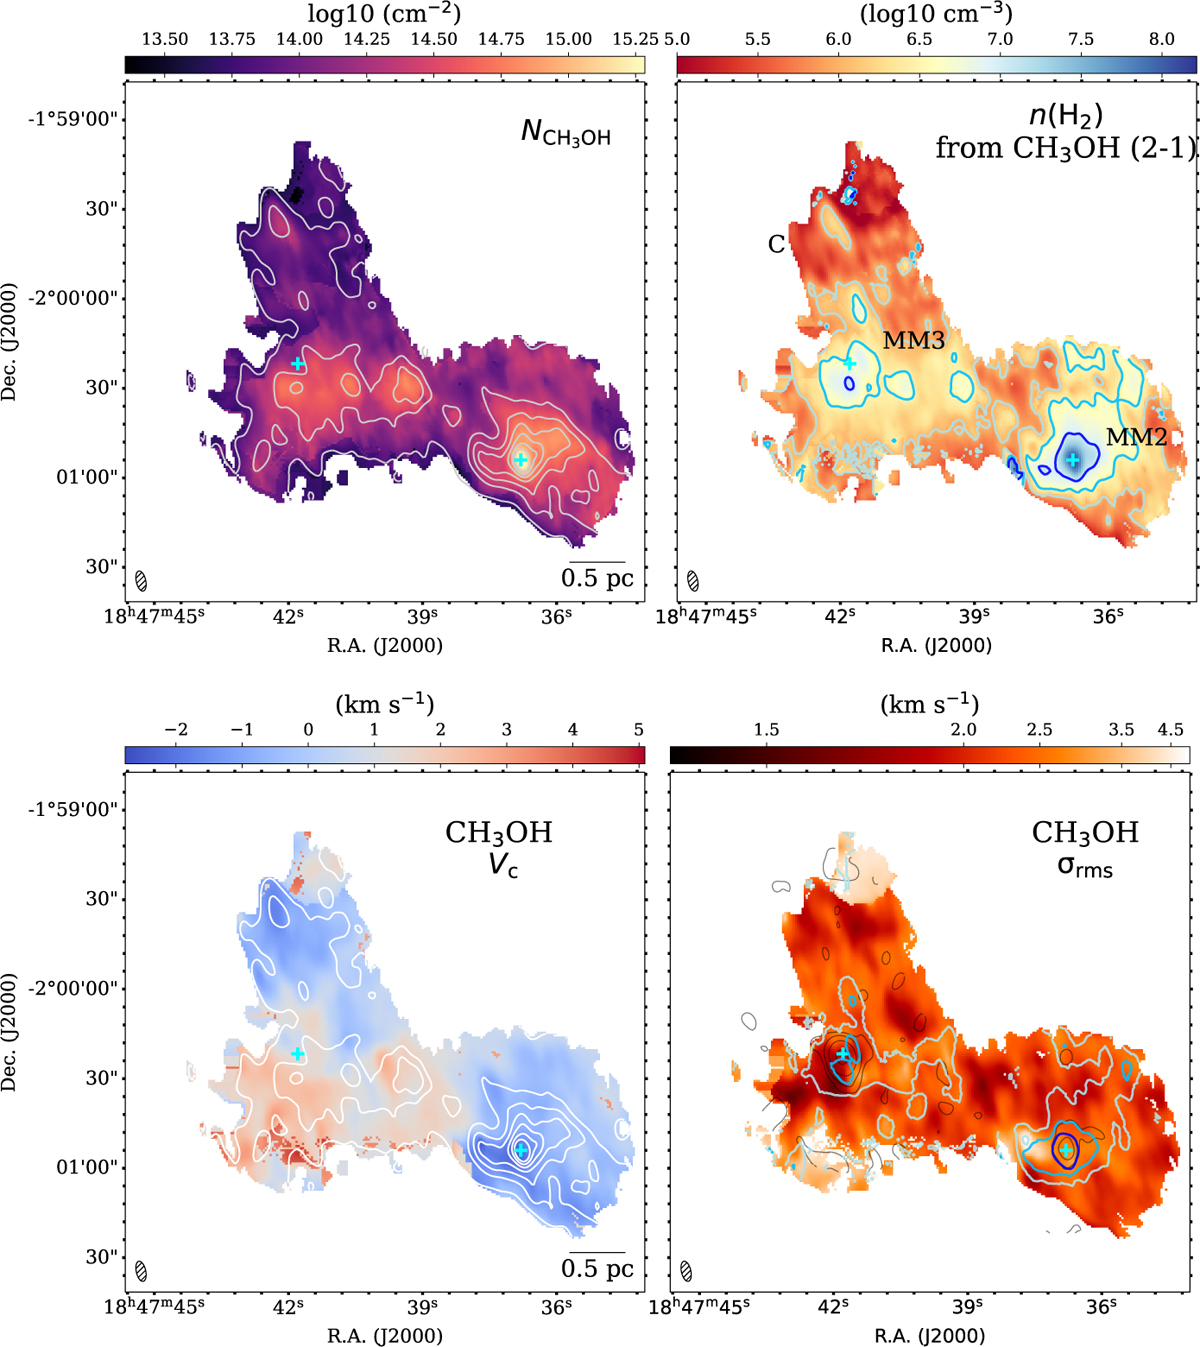
Fig. 7
Download original image
Derived CH3OH column density (E-type) and hydrogen volume density distribution from RADEX modelling for clumps MM2, MM3, and C (upper panel). One-component Gaussian fit result of CH3OH (2–1) line series (lower panel). The centroid velocity (with respect to VLSR = 91.7 km s–1) and velocity dispersion (σv = ΔV/2.355) distribution. In left panels, the contours represent integrated intensity levels of CH3OH E-type 2(0,1)–1(0,1) line. The velocity range for integration is 85–100 km s–1, and the contour levels are from 1.3 K km s–1 (7 σ) to 37 K km s–1 (0.75 times peak emission value of MM2) with seven uniform intervals. In right panels, the gray contours represent the 3 mm continuum emission, and are logarithmically spaced from 2σv (σv = 1.6 mJy beam–1) to 225.0 mJy beam–1 with five intervals (same as Fig. 2). Cyan crosses mark the 3 mm continuum peak of MM2 and MM3. The green contours indicate n(H2) levels of 106.1 cm–3 and 107 cm–3.
Current usage metrics show cumulative count of Article Views (full-text article views including HTML views, PDF and ePub downloads, according to the available data) and Abstracts Views on Vision4Press platform.
Data correspond to usage on the plateform after 2015. The current usage metrics is available 48-96 hours after online publication and is updated daily on week days.
Initial download of the metrics may take a while.