Fig. 6
Download original image
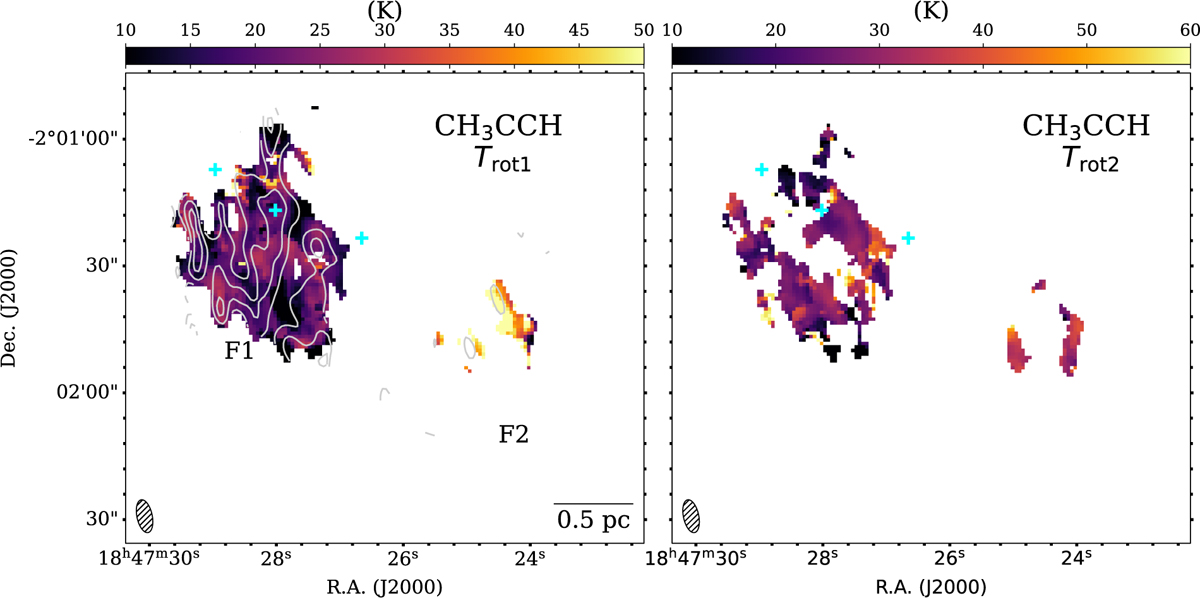
Same as Fig. 5, but for the clumps F1 and F2. In the left panel the contours represent integrated intensity map of CH3CCH 52–42 line. The velocity range for integration is 75–105 km s–1, and the contour levels are from 0.45 K km s–1 (3σ) to 0.8 K km s–1 (0.9 times peak emission value of F1) with three uniform intervals. Cyan crosses mark the three cores from 3 mm continuum of F1 (as in Fig. 2, right panel).
Current usage metrics show cumulative count of Article Views (full-text article views including HTML views, PDF and ePub downloads, according to the available data) and Abstracts Views on Vision4Press platform.
Data correspond to usage on the plateform after 2015. The current usage metrics is available 48-96 hours after online publication and is updated daily on week days.
Initial download of the metrics may take a while.