Fig. D.1
Download original image
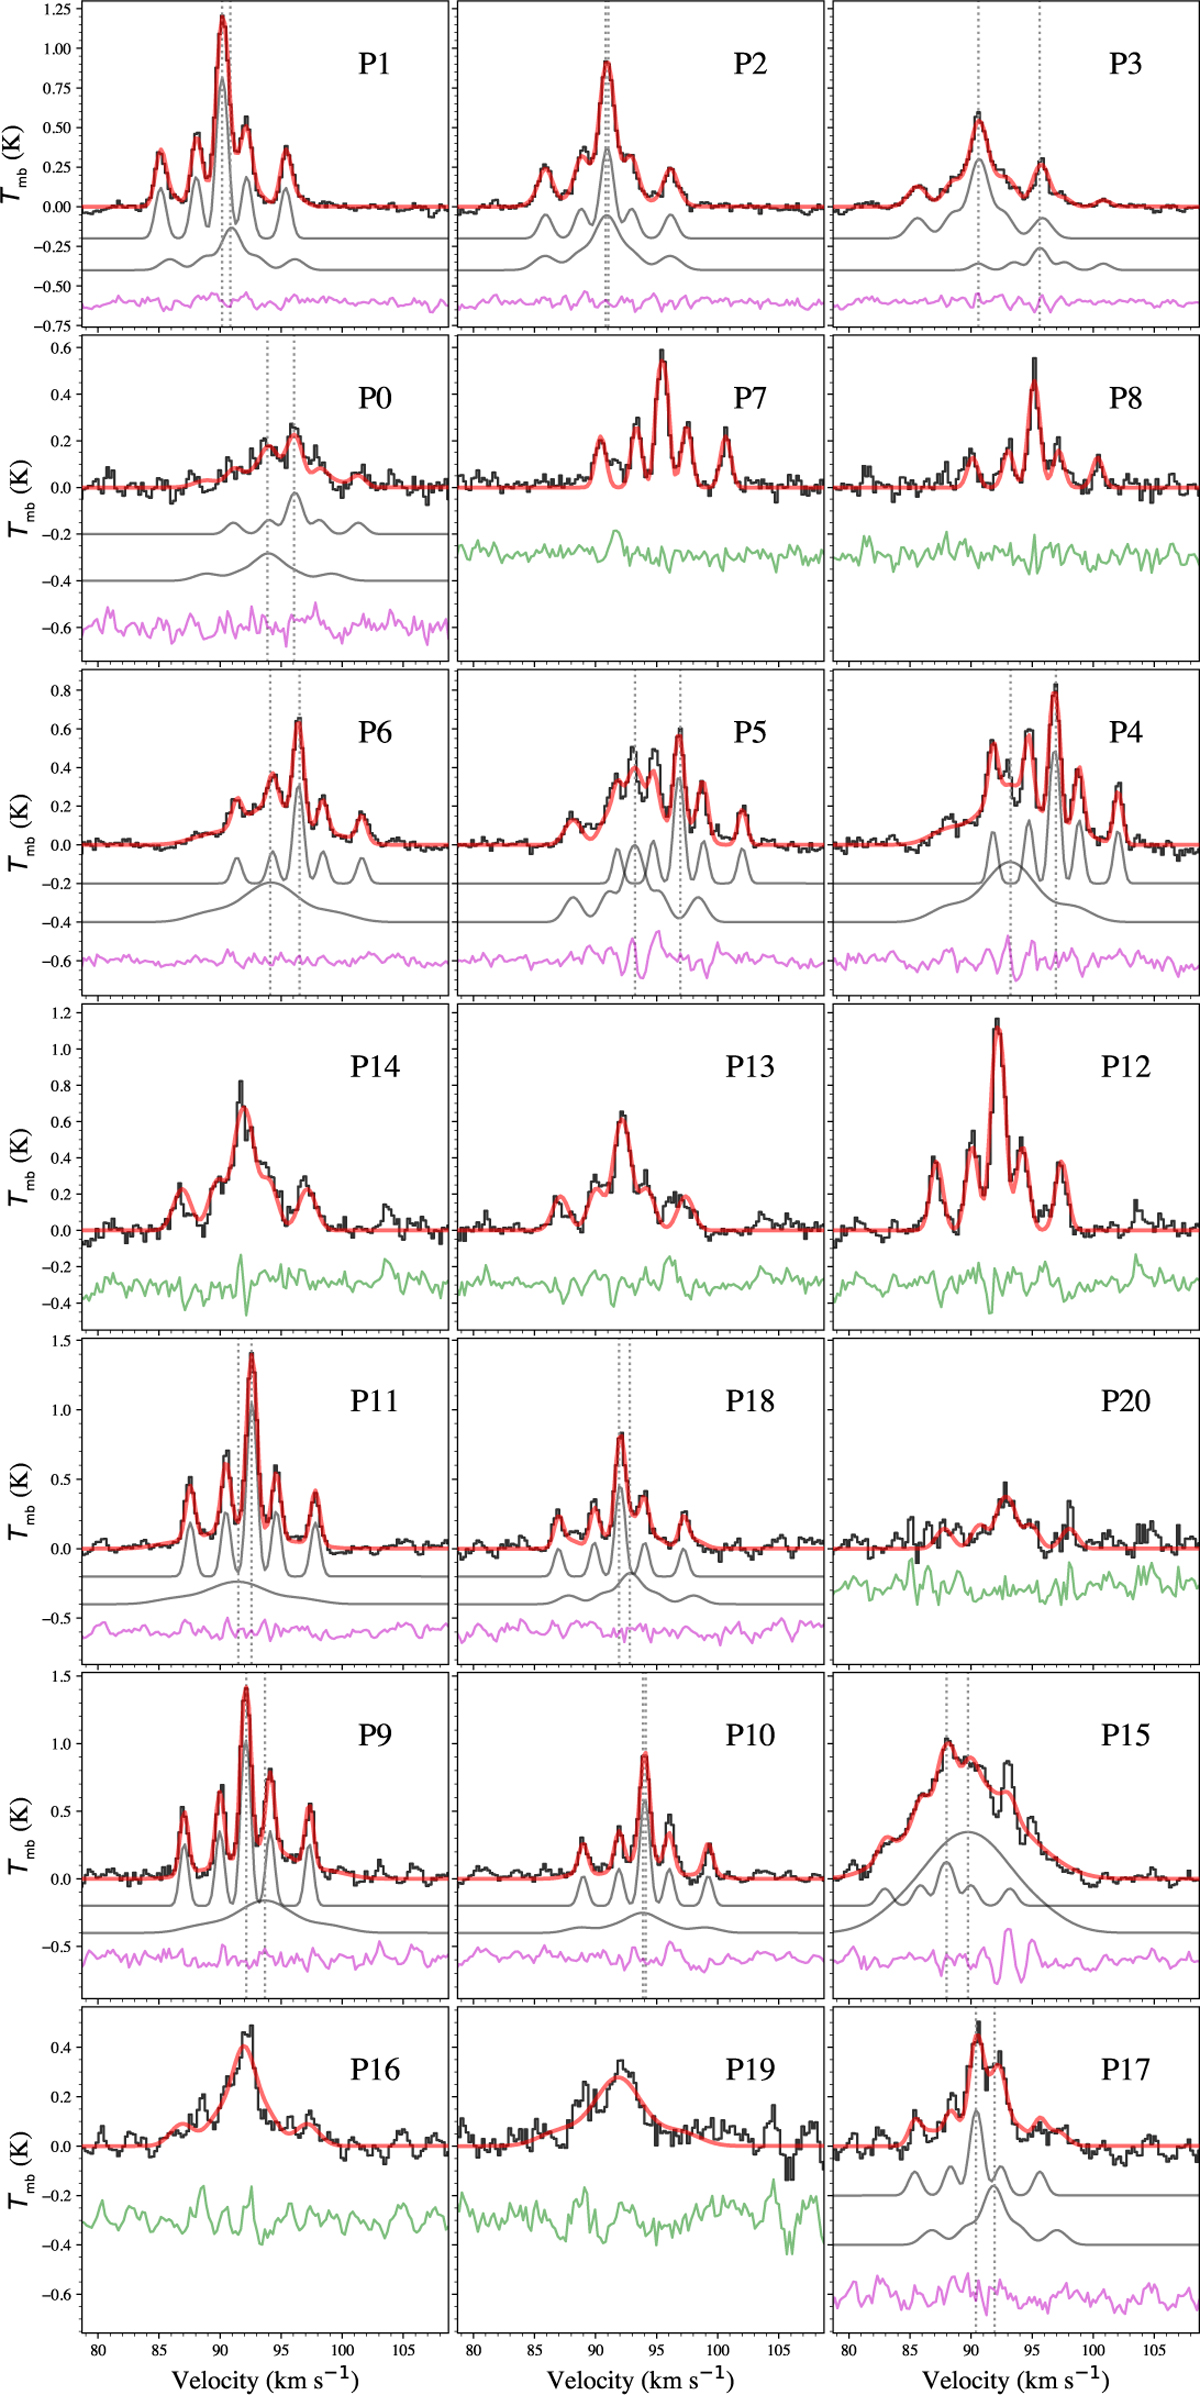
NH2D spectra of the dendrogram identified cores in clumps MM2, MM3, and C. For cores that a single hfs component fit suffices to reproduce the line profile, the model is shown as red line, whereas two-component hfs fits are shown as blue (sum) line and gray lines (manually adding offset from zero level) for the two components, separately. Vertical dotted lines indicate the peak velocity of the two-component models. The core names are denoted as Pn with n of integers between [0, 20] (Fig. 14, upper panels). The subplots are arranged such that the corresponding cores are located from north-east to south-west along the mosaic region.
Current usage metrics show cumulative count of Article Views (full-text article views including HTML views, PDF and ePub downloads, according to the available data) and Abstracts Views on Vision4Press platform.
Data correspond to usage on the plateform after 2015. The current usage metrics is available 48-96 hours after online publication and is updated daily on week days.
Initial download of the metrics may take a while.