Fig. C.3
Download original image
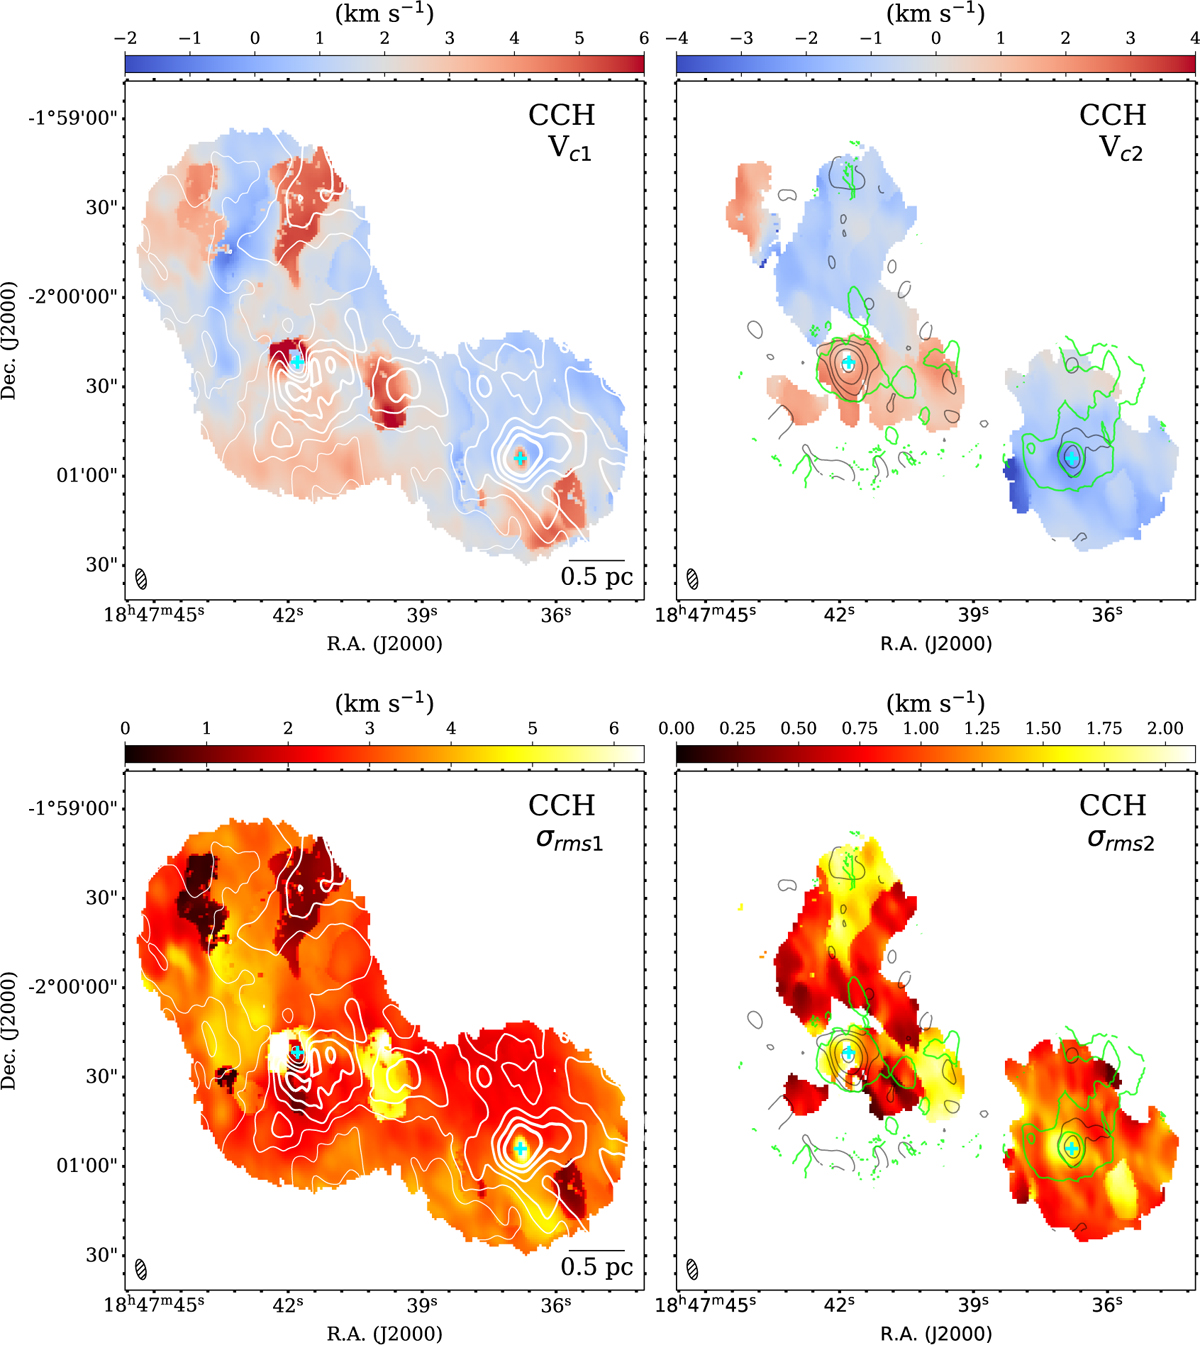
Centroid velocity and velocity dispersion distribution of the two-component Gaussian fits of CCH (1–0) hfs lines (ν~87.3 GHz) for clumps MM2, MM3, and C. The upper and lower panels show the two components individually. White contours in left panels follow same definitions as in Figure C.1, representing the integrated intensity map of CCH. In both the upper and lower panels, the gray and green contours and crosses in left and right plot follow the same definitions as in Figure B.1.
Current usage metrics show cumulative count of Article Views (full-text article views including HTML views, PDF and ePub downloads, according to the available data) and Abstracts Views on Vision4Press platform.
Data correspond to usage on the plateform after 2015. The current usage metrics is available 48-96 hours after online publication and is updated daily on week days.
Initial download of the metrics may take a while.