Fig. 3
Download original image
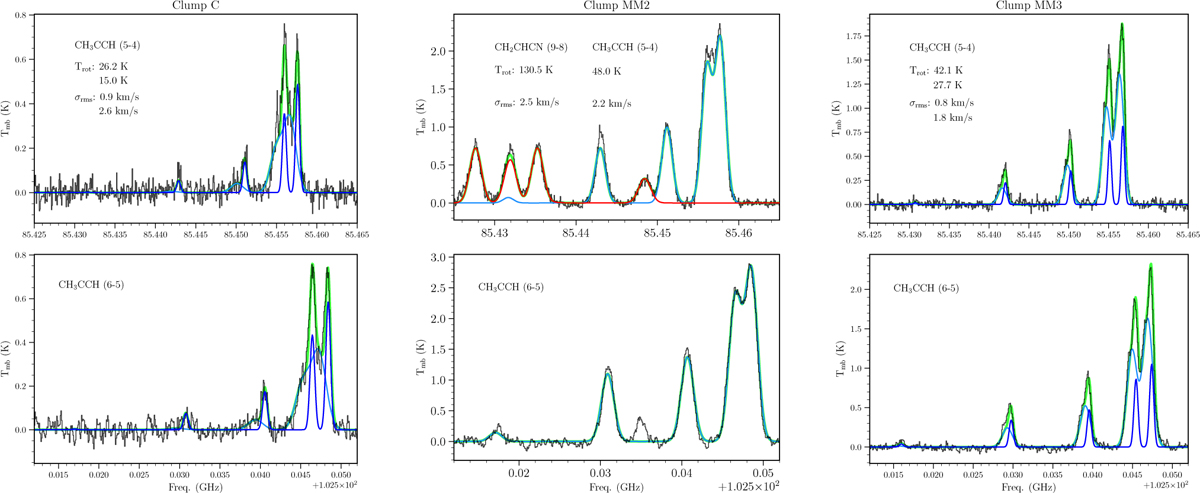
CH3CCH spectra at the peak emission of clumps C, MM2, and MM3. For clump MM2, the CH2CHCN emission is detected, with red line showing the fitting result. In all plots, whenever there are more than one velocity component, both the composite line profile of the fits (green line) and the individual fit for each component (blue lines) are shown. The parameters of the peak intensity (Tmb) and linewidth (∆V) are listed in Table 4.
Current usage metrics show cumulative count of Article Views (full-text article views including HTML views, PDF and ePub downloads, according to the available data) and Abstracts Views on Vision4Press platform.
Data correspond to usage on the plateform after 2015. The current usage metrics is available 48-96 hours after online publication and is updated daily on week days.
Initial download of the metrics may take a while.