Fig. C.1
Download original image
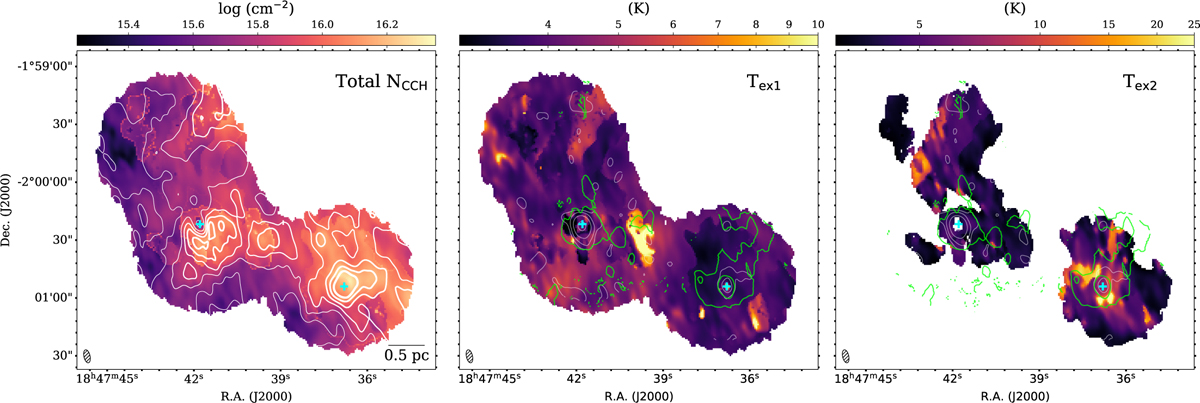
CCH column density and excitation temperatures from the two-component hfs fitting for clumps MM2, MM3 and C. White contours in the left panels represent the integrated intensity map of CCH l1,1–01,1 line (85–100 km s−1), from 3.3 K km s−1 (7 σ) to 9.8 K km s−1 (0.9 times the peak emission of MM2) with six uniform intervals. The gray and green contours and crosses follow the same definitions as in Figure B.1.
Current usage metrics show cumulative count of Article Views (full-text article views including HTML views, PDF and ePub downloads, according to the available data) and Abstracts Views on Vision4Press platform.
Data correspond to usage on the plateform after 2015. The current usage metrics is available 48-96 hours after online publication and is updated daily on week days.
Initial download of the metrics may take a while.