Fig. A.6
Download original image
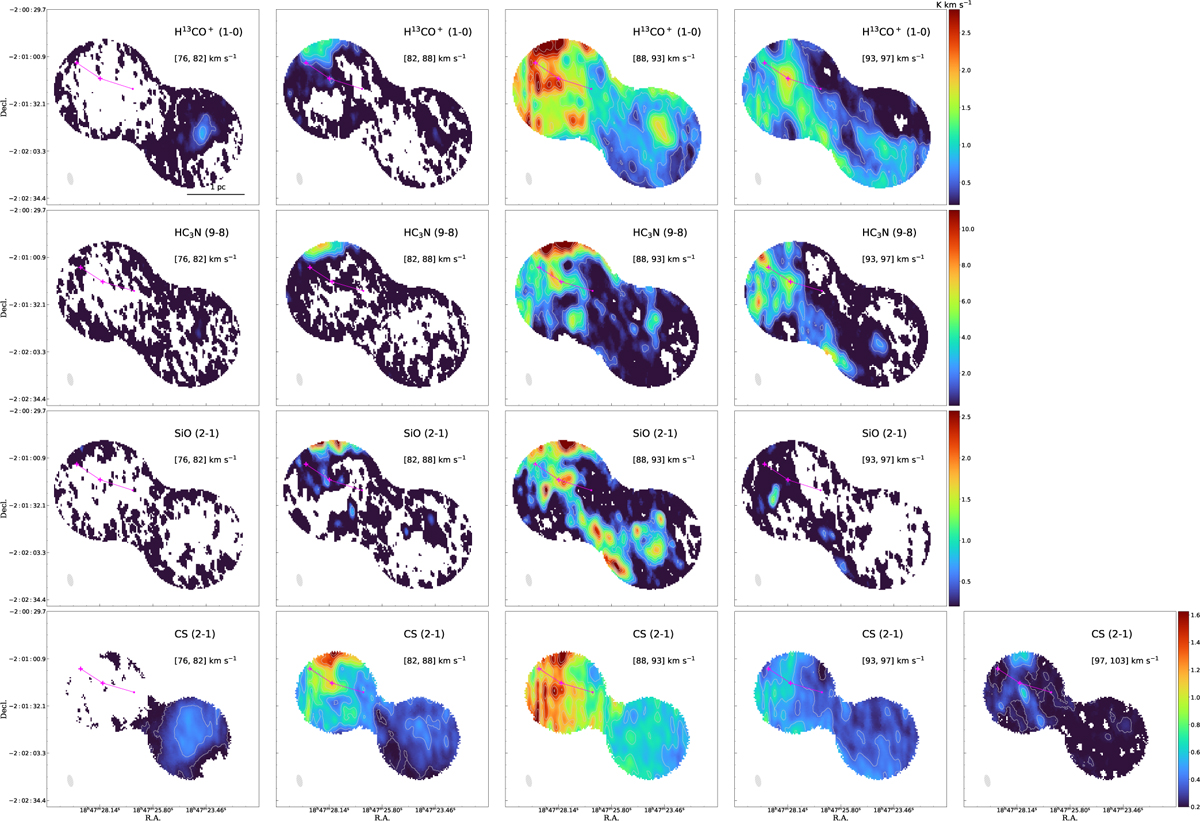
Same as Figure A.4, but for the southern region containing clump F1 and F2. The 3 mm continuum peaks of clump F2 are indicated as orange crosses and linked with lines to indicate the filament ridge. Contour levels start from 0.4 K km s−1 to the peak integrated intensities of the [88, 93] km s−1 range with eight uniform intervals. The peak integrated intensities are 11.3, 4.8, 2.8, 2.6 K km s-1 for CS (2–1), SO (23–12), H13CO+ (1–0), and HC3N (9–8), respectively. Integrated intensity maps of certain velocity range for some lines are trimmed if the emission is not significant.
Current usage metrics show cumulative count of Article Views (full-text article views including HTML views, PDF and ePub downloads, according to the available data) and Abstracts Views on Vision4Press platform.
Data correspond to usage on the plateform after 2015. The current usage metrics is available 48-96 hours after online publication and is updated daily on week days.
Initial download of the metrics may take a while.