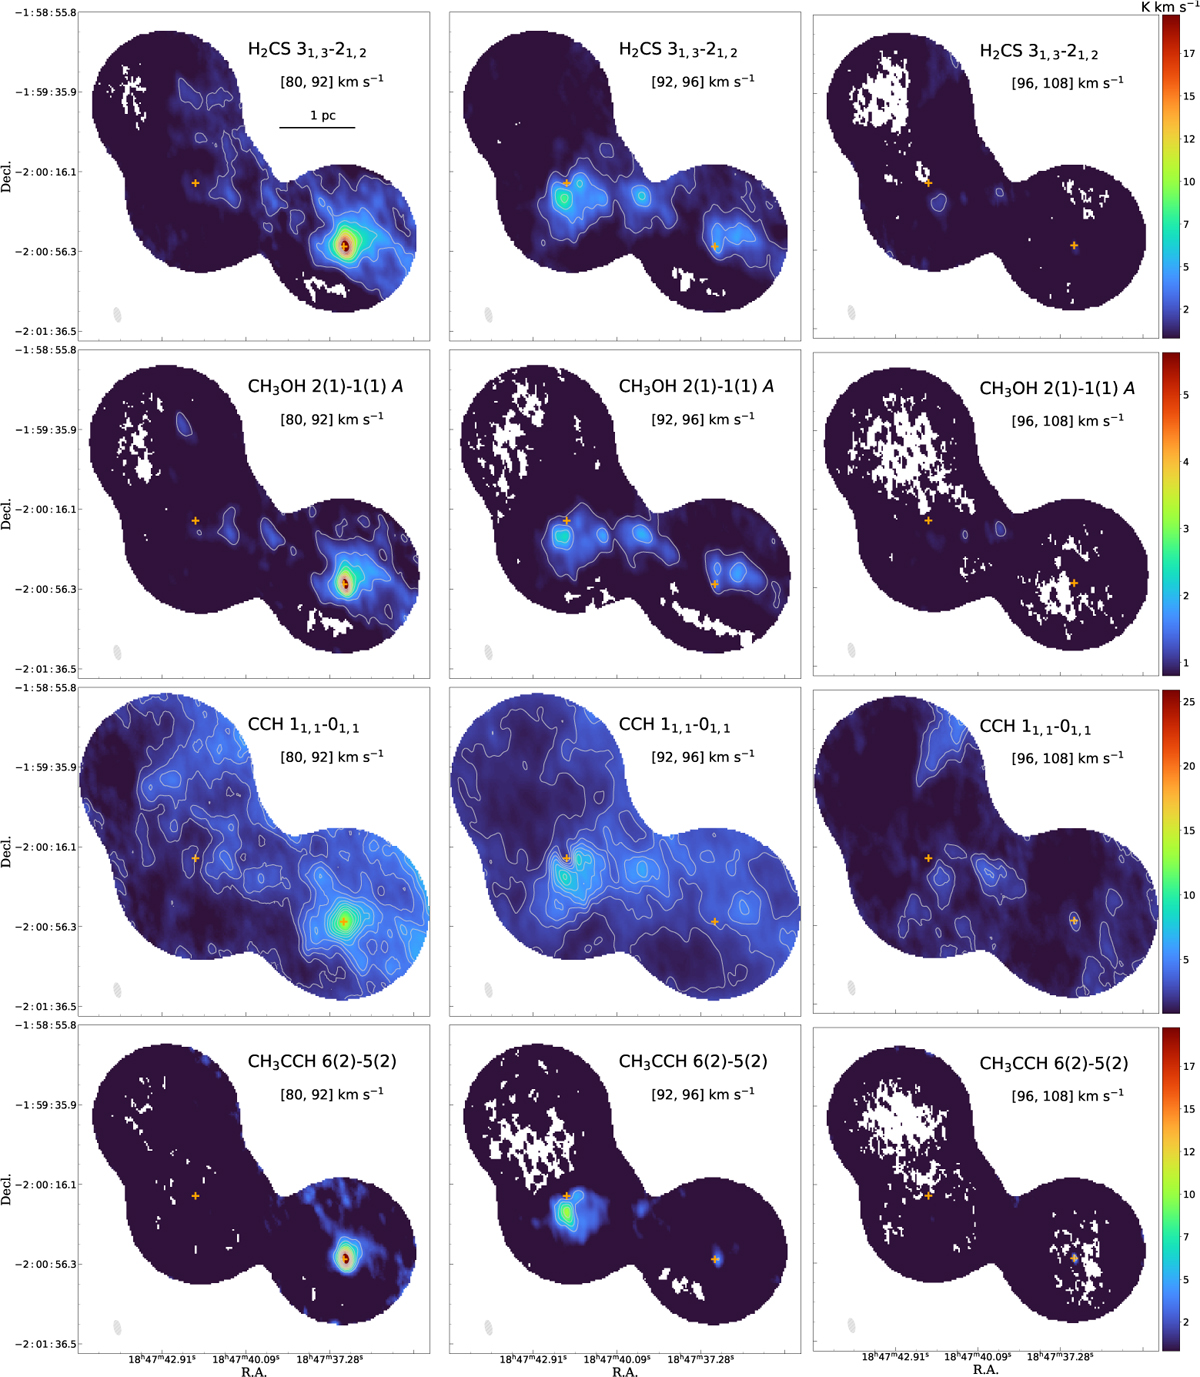
Fig. A.5
Download original image
Integrated intensity maps of CS (2–1), SO (23–12), H13CO+ (1–0), and HC3N (9–8). The velocity ranges for integration are indicated in each subplot, which are selected based on the present velocity components of the overall average spectrum of CS (2–1) line. The 3 mm continuum peaks of clump MM3 and MM2 are indicated as orange crosses. Contour levels start from 1.6 K km s−1 to the peak integrated intensities of the [80, 92] km s−1 range with eight uniform intervals. The peak integrated intensities are 76.4, 29.0, 12.5, 41.9 K km s−1 for CS (2–1), SO (23–12), H13CO+ (1–0), and HC3N (9–8), respectively.
Current usage metrics show cumulative count of Article Views (full-text article views including HTML views, PDF and ePub downloads, according to the available data) and Abstracts Views on Vision4Press platform.
Data correspond to usage on the plateform after 2015. The current usage metrics is available 48-96 hours after online publication and is updated daily on week days.
Initial download of the metrics may take a while.