Fig. A.1
Download original image
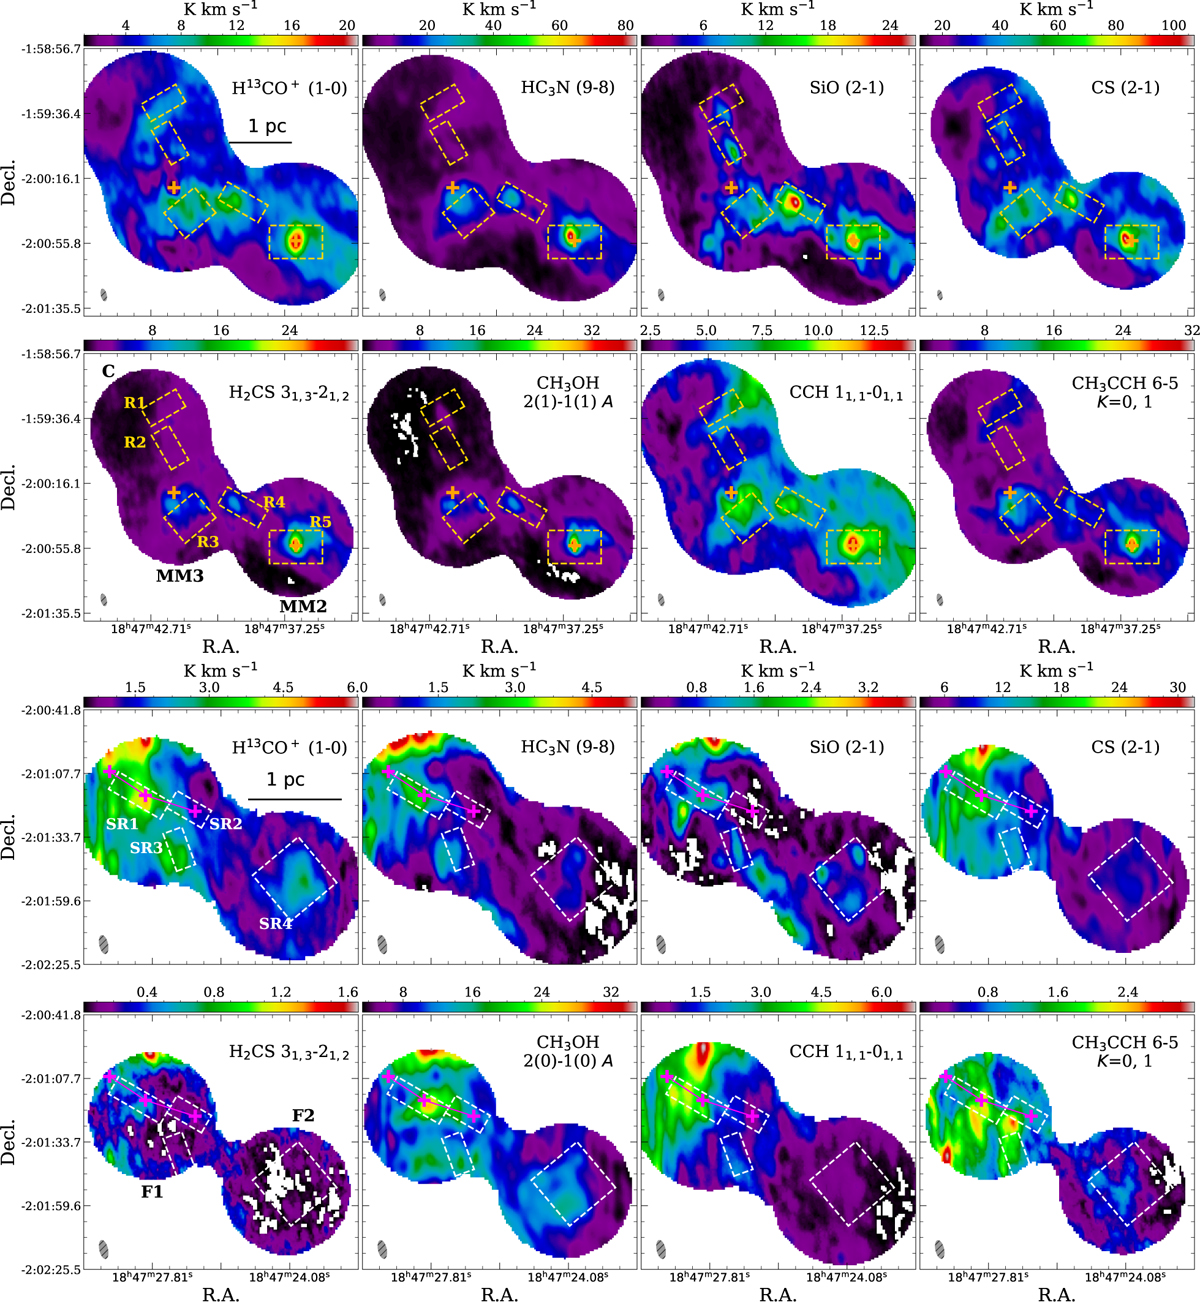
Distribution of molecular gas tracers towards the surveyed massive clumps. Upper panel: integrated intensity maps of multiple molecular lines towards clumps MM2, MM3 and C. Lower panel: Integrated intensity maps of multiple molecular lines towards clump F1 and F2. For both panels, the velocity range for integration for both regions is [80, 100] km s−1. Before generating the integrated intensity maps, all channels with intensity <0.1 K (2σ) are masked.
Current usage metrics show cumulative count of Article Views (full-text article views including HTML views, PDF and ePub downloads, according to the available data) and Abstracts Views on Vision4Press platform.
Data correspond to usage on the plateform after 2015. The current usage metrics is available 48-96 hours after online publication and is updated daily on week days.
Initial download of the metrics may take a while.