Fig. 2
Download original image
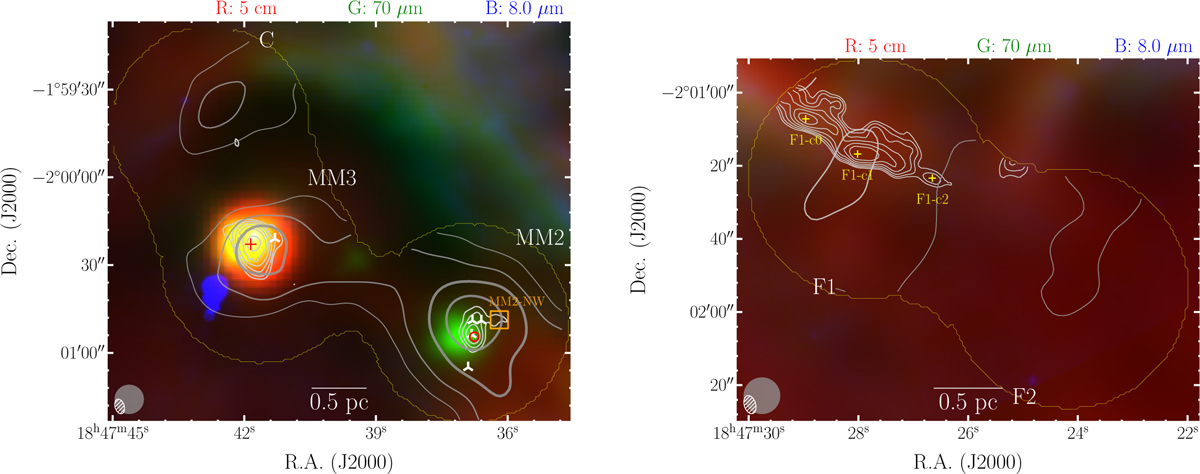
Three-colour images of the clumps (red: GLOSTAR 5 cm radio continuum; green: Herschel Hi-GAL PACS 70 µm; blue: Spίtzer 8.0 µm), overlaid with contour levels of NOEMA 3 mm continuum emission (white contours) and N(H2) (gray contours). The beams for the 3 mm continuum and the N(H2) map (10″) are shown in bottom left corner. The outer yellow solid lines indicate the NOEMA fleld-oſ-view of the observations. Left: target clump C, MM2, and MM3. The UCHπ region (red cross) and OH maser (red circle), methanol masers (white three-branched triangles), and the northwestern substructure in clump MM2 (orange rectangle) are marked. Contour levels of the 3 mm continuum are logarithmic-spaced from 2σv (σv = 1.6 mJy beam−1) to 225.0 mJy beam−1 with five intervals. Contour levels of the N(H2) map have values of log10(N(H2)) = [22.75, 23.0, 23.25, 23.5] cm−2. Right: target clump Fl and F2. Contour levels of 3 mm continuum are logarithmic-spaced from 2σv (σv = 0.4 mJy beam−1) to 3.3 mJy beam−1 with five intervals. The three compact sources are marked with yellow pluses. Contour levels of the N(H2) map have values of 10[22.4,22.7]cm−2.
Current usage metrics show cumulative count of Article Views (full-text article views including HTML views, PDF and ePub downloads, according to the available data) and Abstracts Views on Vision4Press platform.
Data correspond to usage on the plateform after 2015. The current usage metrics is available 48-96 hours after online publication and is updated daily on week days.
Initial download of the metrics may take a while.