Fig. 18
Download original image
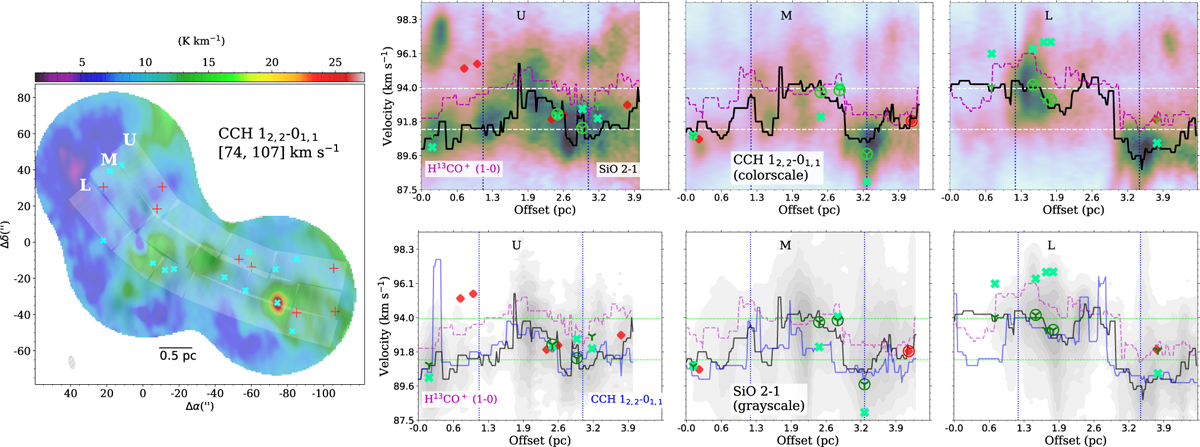
Position of NH2D cores on CCH integrated intensity map (left). Red crosses mark the NH2D cores that have two velocity components, and cyan crosses mark those of one velocity component. Relation of NH2D cores with CCH and H13CO+ emission (right), shown as position-velocity diagram. The three panels are position-velocity cuts along the shaded bands U, M, and L in left figure. Peak velocities along the spatial offset for different lines are shown as dashed or solid lines with respective colours (H13CO+: magenta, SiO: black, CCH: blue). Background colour scale shows the PV diagram of CCH (in upper panel) and SiO (in lower panel). NH2D cores with two velocity components are marked as green X and three-branched triangles, and those with only one velocity component are shown as red diamonds. NH2D cores that have σv>0.85 km s−1 are marked with an additional hollow circle around the aforementioned markers.
Current usage metrics show cumulative count of Article Views (full-text article views including HTML views, PDF and ePub downloads, according to the available data) and Abstracts Views on Vision4Press platform.
Data correspond to usage on the plateform after 2015. The current usage metrics is available 48-96 hours after online publication and is updated daily on week days.
Initial download of the metrics may take a while.