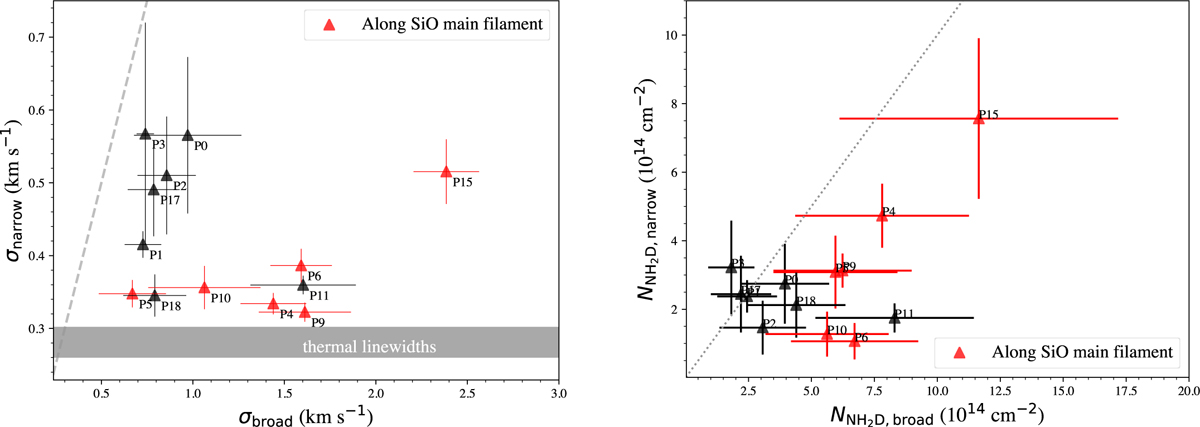
Fig. 15
Download original image
Relation between the narrow linewidths and broad linewidths of spectra of NH2D cores residing in clumps MM2, MM3, and C (left). The gray dashed line indicates equal linewidths. NH2D cores that reside along the main filament of SiO emission are marked in red, and others in black. The shaded region indicates the thermal linewidths based on Trot map derived by CH3CCH lines (Sect. 3.2). Comparison between column density of NH2D of the narrow linewidth and broad linewidth components (right). The gray dashed line indicates equal column density.
Current usage metrics show cumulative count of Article Views (full-text article views including HTML views, PDF and ePub downloads, according to the available data) and Abstracts Views on Vision4Press platform.
Data correspond to usage on the plateform after 2015. The current usage metrics is available 48-96 hours after online publication and is updated daily on week days.
Initial download of the metrics may take a while.