Fig. 14
Download original image
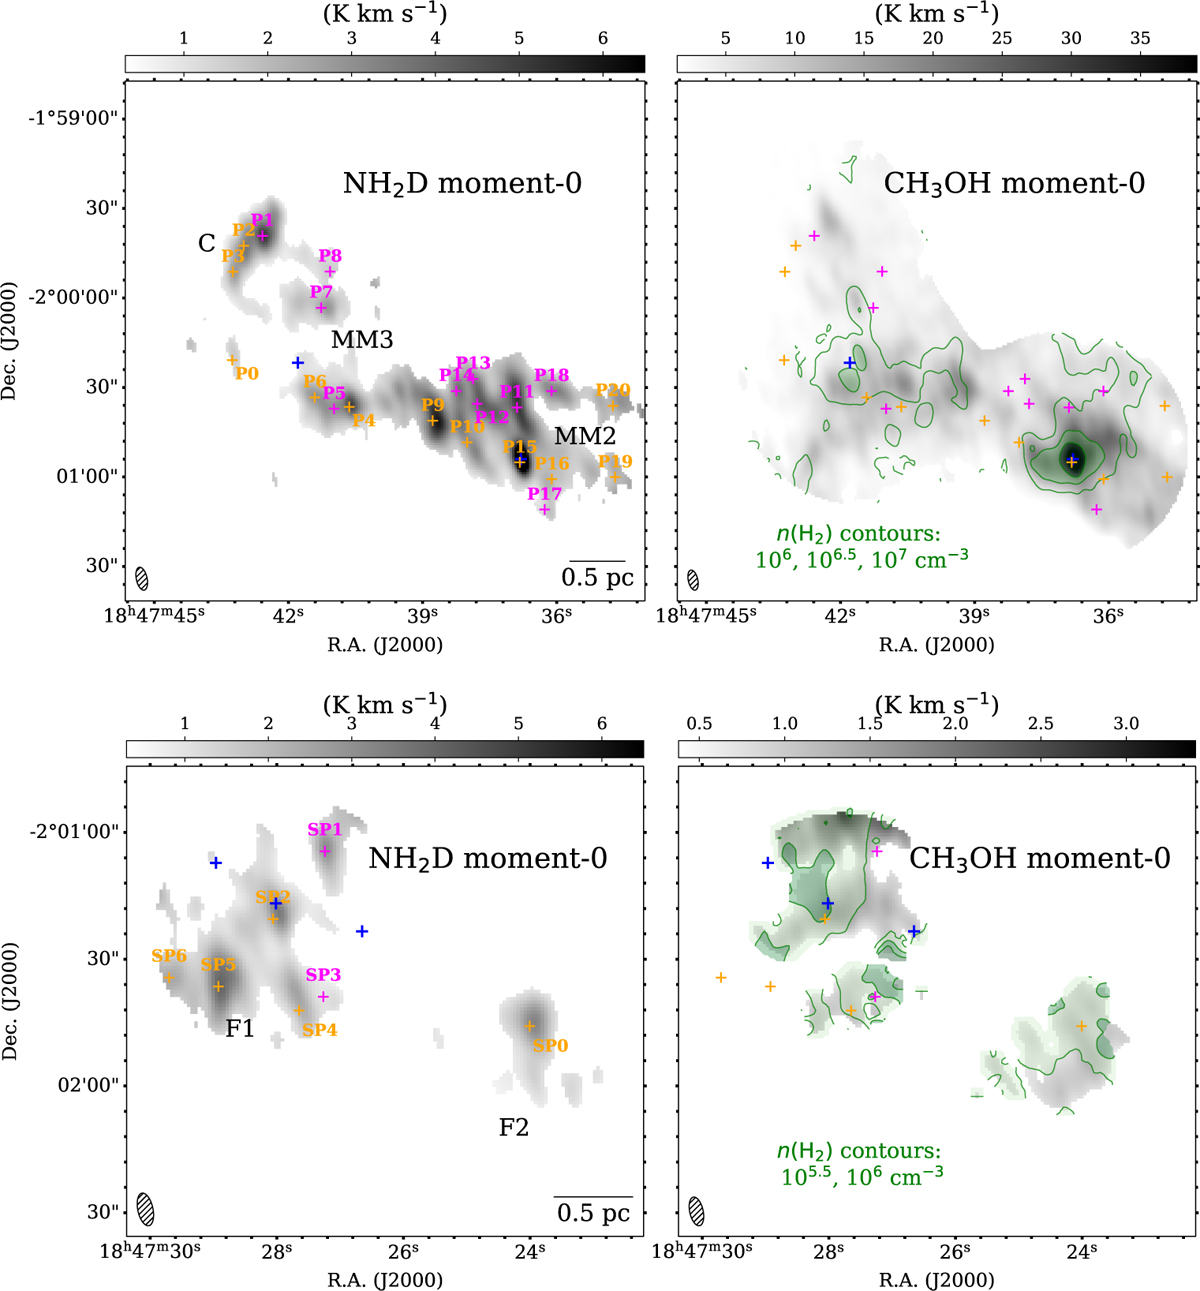
Integrated intensity map of NH2D line emission of clumps MM2, MM3, and C (colourscale, of velocity range 80–115 km s–1) are shown in the upper-left panel and marked with locations of NH2D cores by crosses of different colours. The orange crosses indicate the cores which have a σv>0.85 km s–1 velocity components and magenta crosses represent cores that only have narrow velocity components, σv≲0.5 km s–1. Integrated intensity map of CH3OH 2(0,2)–1(0,1) line (colourscale, of velocity range 85– 100 km s-1 ) overlaid by contours of n(H2) map (green) shown in the upper-right panel. In both plots, the blue crosses mark the position of the peak intensity of the 3 mm continuum of clumps MM2 and MM3. Lower panels: same as the upper panels, but for the clumps F1 and F2. In both plots, the blue crosses mark the position of the three cores in the 3 mm continuum of clump F1 (as in Fig. 2, right panel).
Current usage metrics show cumulative count of Article Views (full-text article views including HTML views, PDF and ePub downloads, according to the available data) and Abstracts Views on Vision4Press platform.
Data correspond to usage on the plateform after 2015. The current usage metrics is available 48-96 hours after online publication and is updated daily on week days.
Initial download of the metrics may take a while.