Fig. 13
Download original image
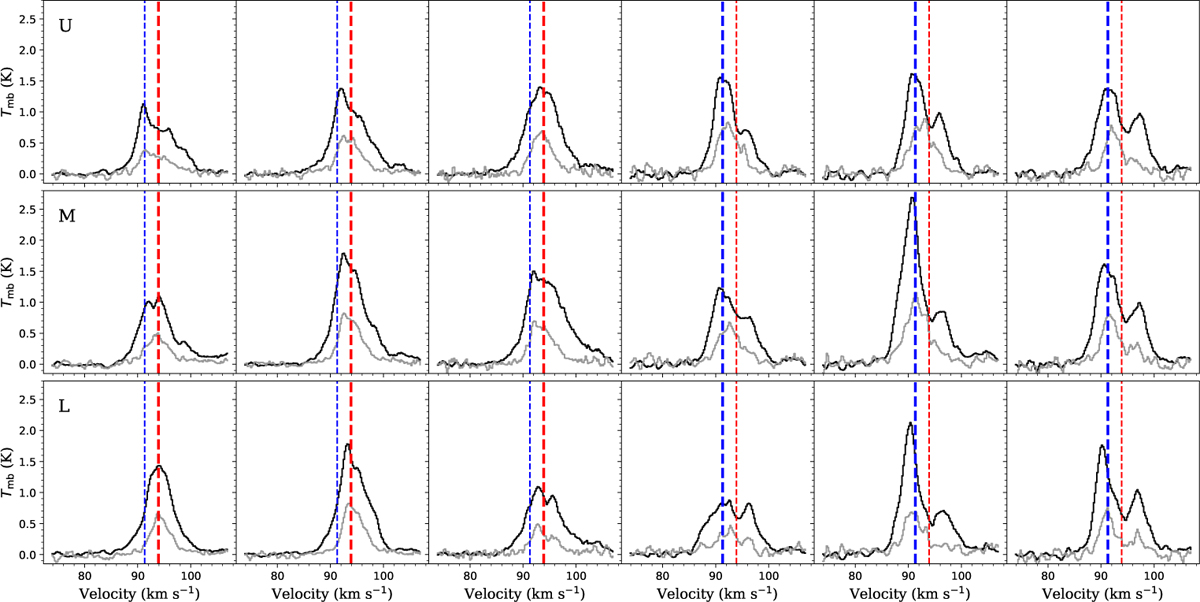
Average spectrum of the main line of CCH hfs component 12,2–01,1 (black line) and the satellite line 11,2–01,0 (gray line, the intensity is artificially enlarged by three times for comparison) along the three PV cuts U, M, L. From left to right, the spectra are arranged from northeast to southwest along the cuts. The blue and red dashed lines follow that in Fig. 10.
Current usage metrics show cumulative count of Article Views (full-text article views including HTML views, PDF and ePub downloads, according to the available data) and Abstracts Views on Vision4Press platform.
Data correspond to usage on the plateform after 2015. The current usage metrics is available 48-96 hours after online publication and is updated daily on week days.
Initial download of the metrics may take a while.