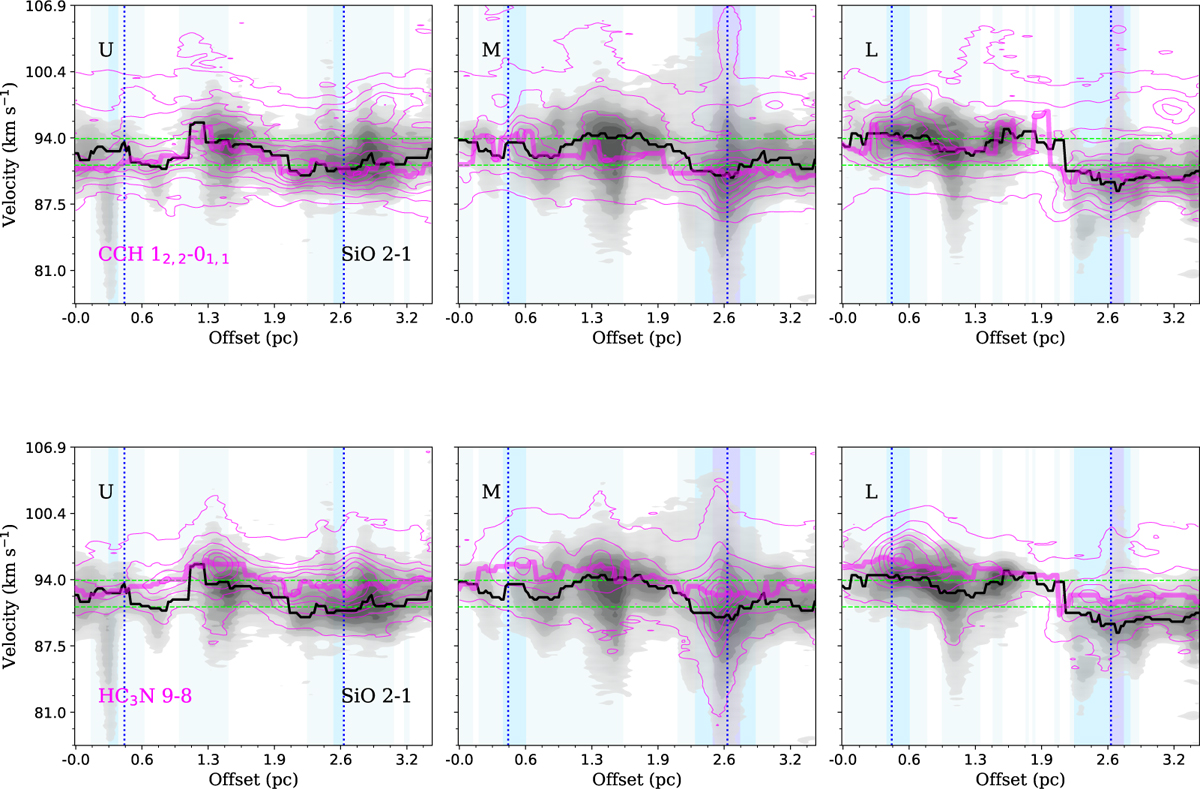
Fig. 11
Download original image
Position-velocity diagram for CCH 12,2–01,1, HC3N (9–8) (in magenta contours) in comparison to that of SiO (2–1) (gray filled contours), along the U, M, and L cuts as illustrated in panel b of Fig. 9. The VLSR of MM2 and MM3 are indicated as green horizontal lines (93.9 km–1 and 91.3 km–1). The vertical dotted line and shaded regions follow those as in Fig. 9. The peak velocity along the spatial offset for SiO (2–1) and the respective molecular line (that have extended emission) in each plot are indicated as black and magenta lines.
Current usage metrics show cumulative count of Article Views (full-text article views including HTML views, PDF and ePub downloads, according to the available data) and Abstracts Views on Vision4Press platform.
Data correspond to usage on the plateform after 2015. The current usage metrics is available 48-96 hours after online publication and is updated daily on week days.
Initial download of the metrics may take a while.