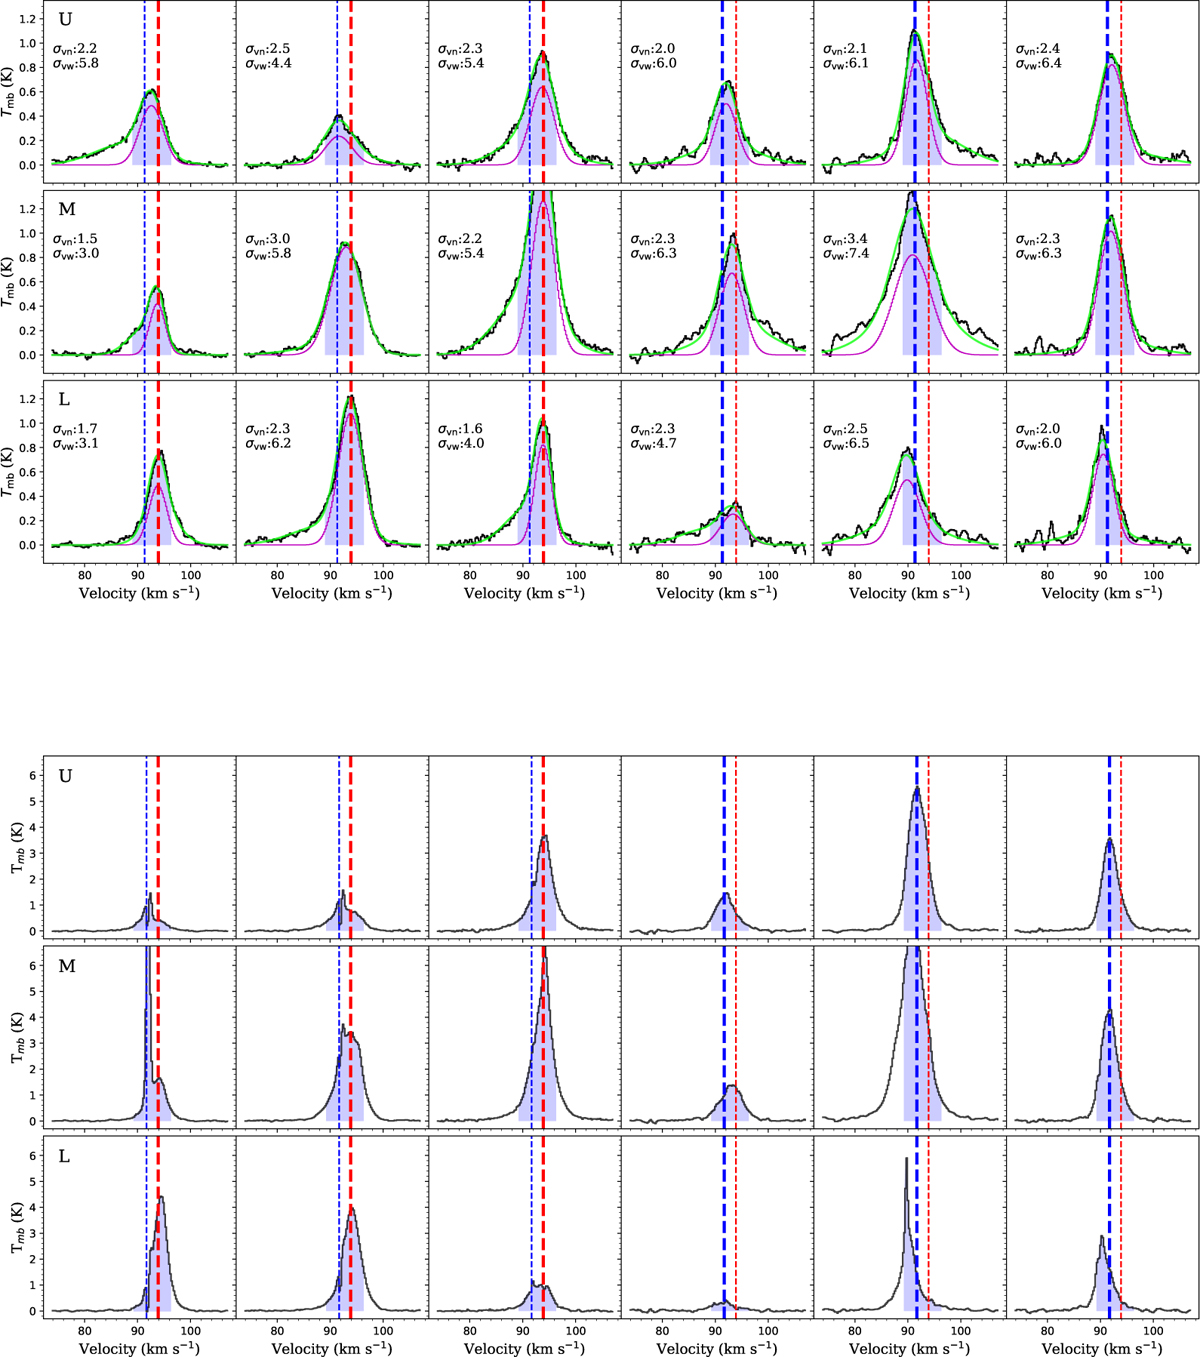
Fig. 10
Download original image
Average spectra of SiO (2–1) (upper panel) and CH3OH 51,5–40,4 (lower panel) along the three PV cuts U, M, L as in panel b of Fig. 9. The spectra are arranged from northeast to southwest along the cuts. The blue and red dashed lines indicate the VLSR of clump MM3 and MM2 (93.9 km s–1 and 91.3 km s–1), with the thicker line corresponding to the VLSR of either clump MM2 or MM3 at this position. The blue shaded regions indicate the line central velocity range from (91.3–2.5) km s–1 to (93.9+2.5) km s–1, which is excluded from the integration of the intensity maps of panel b in Fig. 9. In the upper plot, the two-component Gaussian fit to the SiO line is shown additionally, as green line. The broad-component subtracted spectrum (narrow-component line profile) is shown as magenta line. The velocity dispersions for the two components are indicated in the figure, in unit of km s–1.
Current usage metrics show cumulative count of Article Views (full-text article views including HTML views, PDF and ePub downloads, according to the available data) and Abstracts Views on Vision4Press platform.
Data correspond to usage on the plateform after 2015. The current usage metrics is available 48-96 hours after online publication and is updated daily on week days.
Initial download of the metrics may take a while.