Fig. 1
Download original image
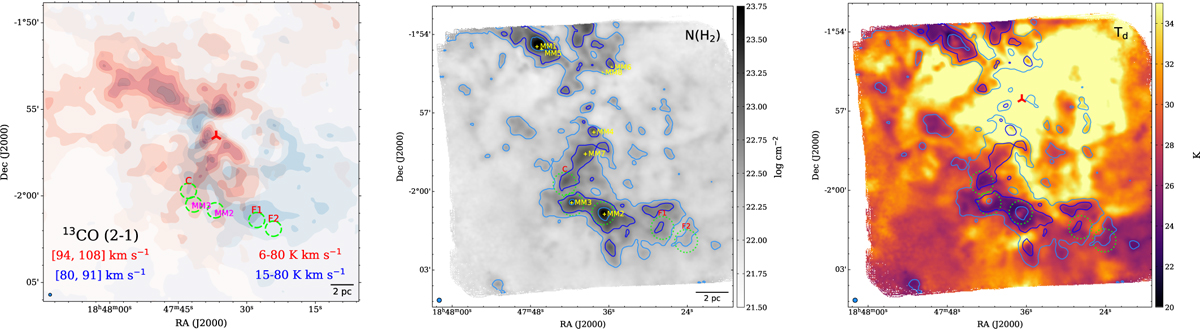
Large-scale structure of W43-main and the distribution of the surveyed massive clumps. Left panel: target clumps overlaid on 13CO (2–1) (obtained by IRAM 30m as in Carlhoff et al. 2013) integrated intensity maps (red and blue contours are integrated intensities over the respective velocity ranges shown in the figure). Middle and right panels: molecular hydrogen column density N(H2) and dust temperature map Td (>35 K temperatures are truncated for better contrast of the cold regions) of the W43-main molecular complex (10″ resolution, Lin et al. 2016). The three contour levels indicate column densities of 2.2×10²², 5×10²², and 2×1023 cm−3 (~1 g cm-2), respectively. The pointed observations towards the 5 selected clumps are shown in green circles of primary beam size (FWHM) at 96 GHz. In the middle panel, the eight most massive clumps identified in Motte et al. (2003) are marked with yellow labels. Other target clumps are marked with red labels, following the names of C, F1 and F2. In the right panel, the red three-branched triangle marks the position of the W-R/OB cluster (Blum et al. 1999).
Current usage metrics show cumulative count of Article Views (full-text article views including HTML views, PDF and ePub downloads, according to the available data) and Abstracts Views on Vision4Press platform.
Data correspond to usage on the plateform after 2015. The current usage metrics is available 48-96 hours after online publication and is updated daily on week days.
Initial download of the metrics may take a while.