Open Access
Fig. 8
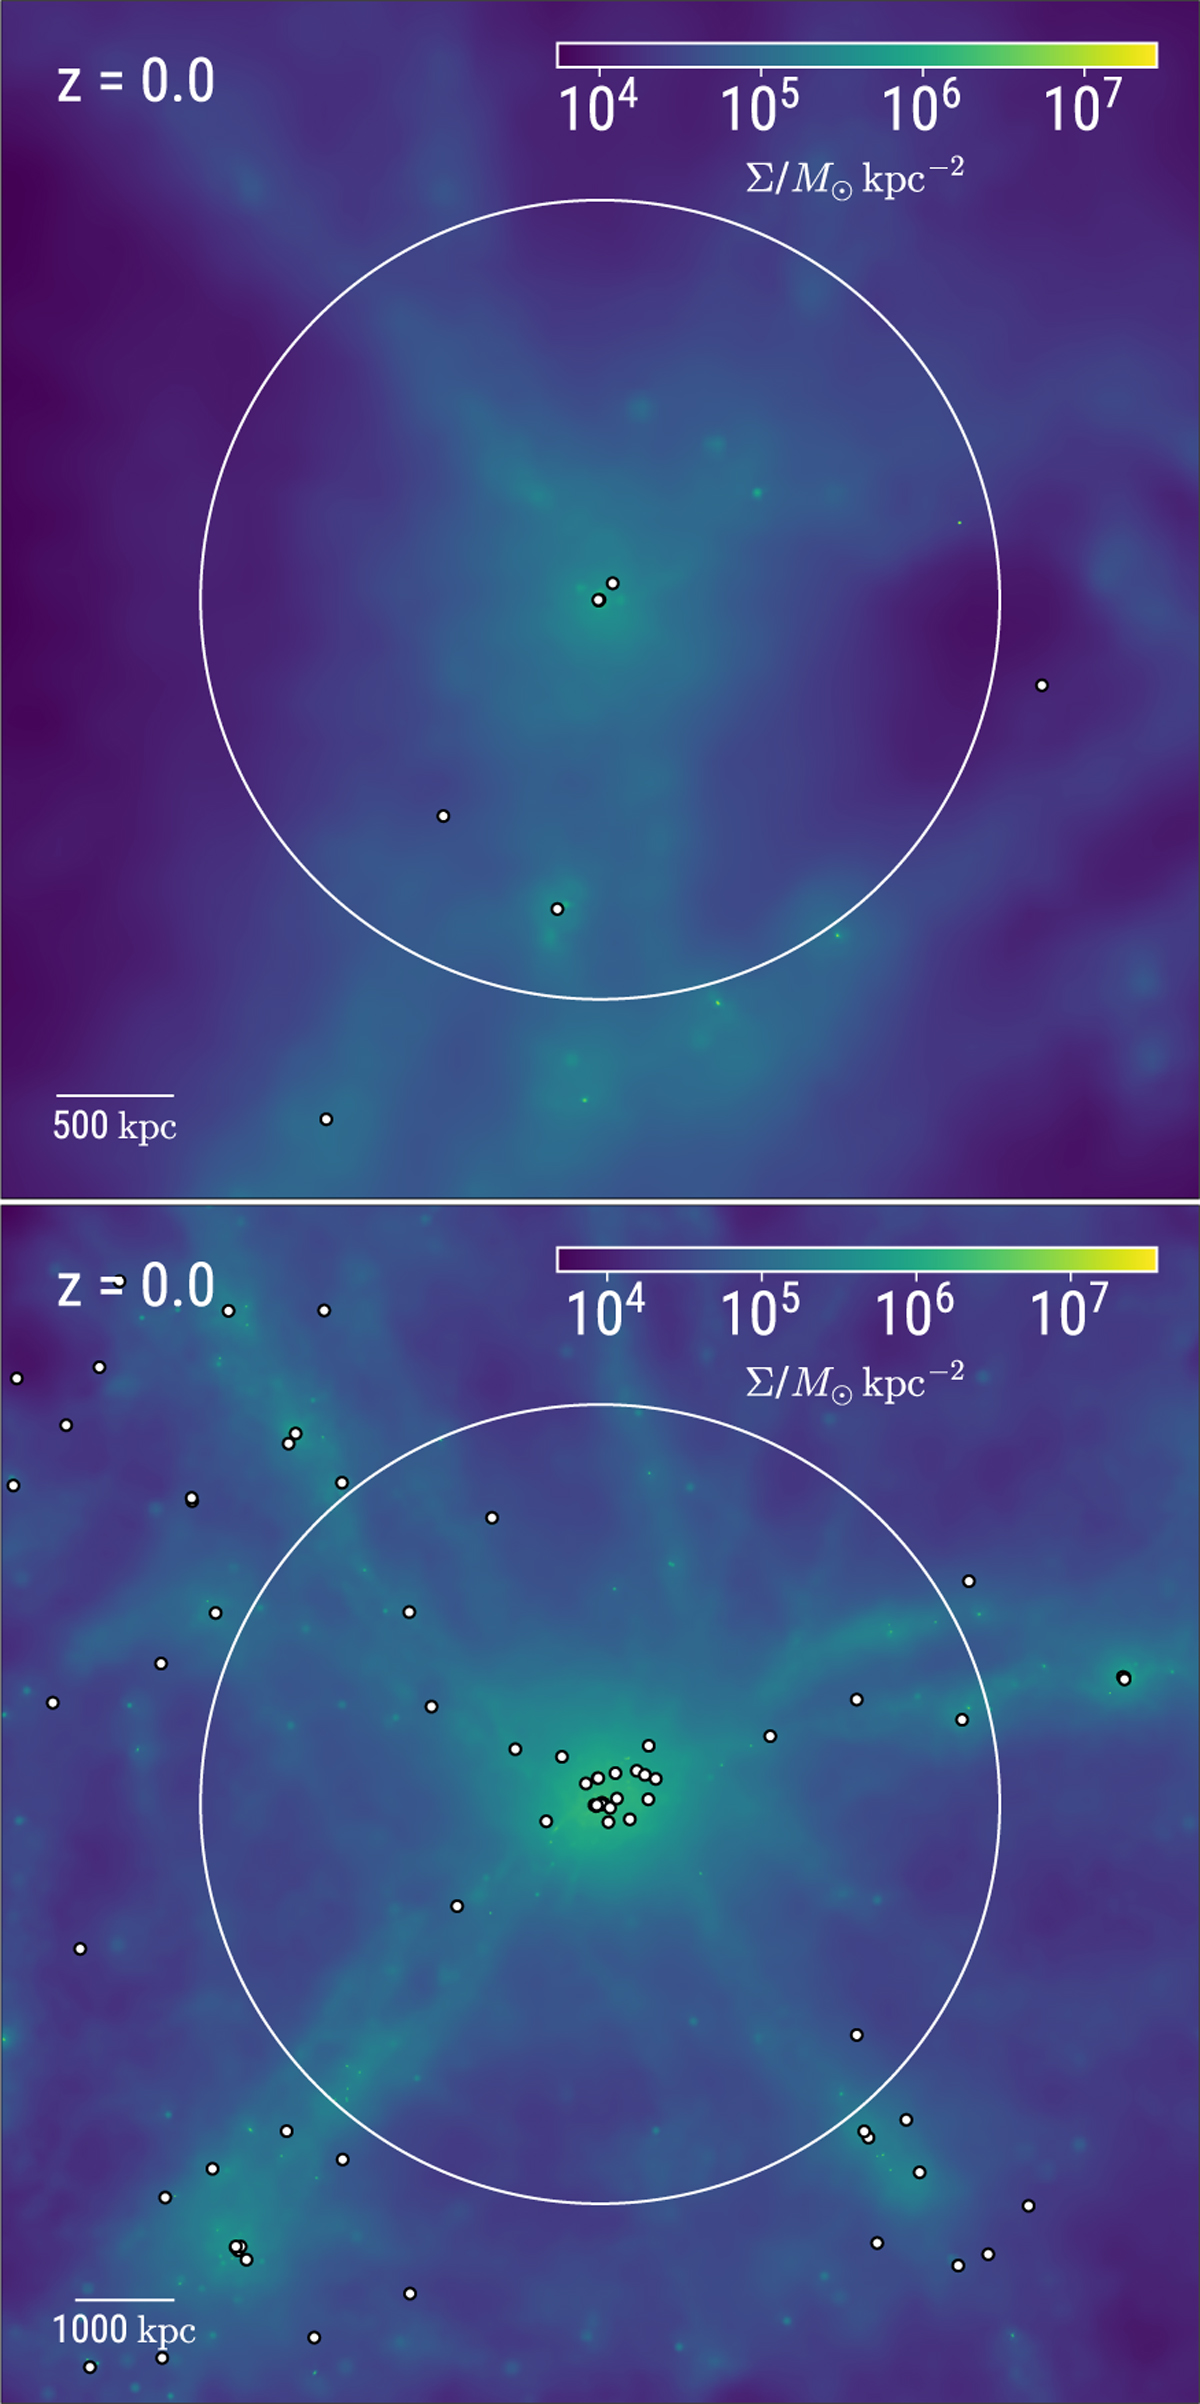
Download original image
Gas surface density maps at z = 0 for the ASIN (top) and DFROGIN (bottom) runs. The white circle indicates a spherical region of radius 5R200, centred on the target halo of the zoom-in region (i.e. the most massive at z = 0). The white dots mark the positions of the BHs in the simulation.
Current usage metrics show cumulative count of Article Views (full-text article views including HTML views, PDF and ePub downloads, according to the available data) and Abstracts Views on Vision4Press platform.
Data correspond to usage on the plateform after 2015. The current usage metrics is available 48-96 hours after online publication and is updated daily on week days.
Initial download of the metrics may take a while.