Fig. 15
Download original image
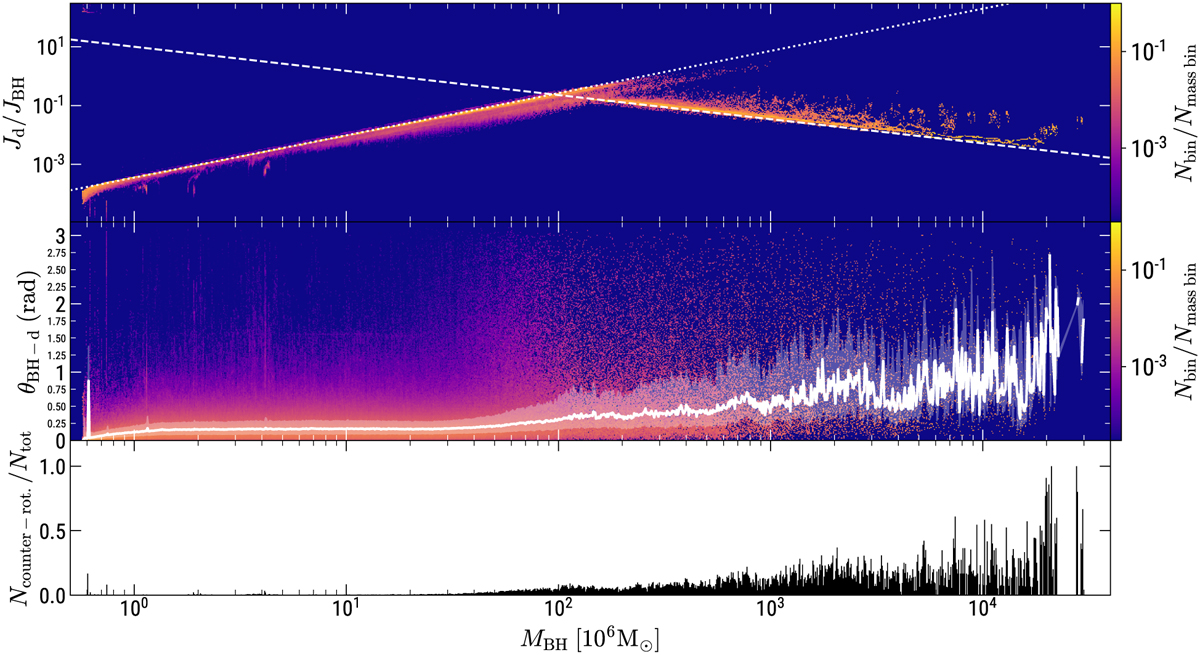
Statistical analysis of a few key properties of the accretion episodes occurred in the Box4 run. The entire set of accretion episodes occurred during the simulation has been considered (i.e. for every BH and at every redshift). The top (middle) panel shows a 2D histogram of the values of Jd/JBH (θBH−d) as a function of mass. Each bin is colour-coded by the number of accretion episodes in that bin (Nbin), normalised to the total number of episodes per mass bin (Nmass bin). In the top panel, the dashed line pinpoints ![]() (for the self-gravitating case, Eq. (23)); the dotted line shows
(for the self-gravitating case, Eq. (23)); the dotted line shows ![]() (non-self-gravitating case, Eq. (19)). a = 0.998 and fEdd = 1 are assumed to plot these reference lines. The bottom panel shows the fraction of counter-rotating accretion episodes over the total, per BH mass bin.
(non-self-gravitating case, Eq. (19)). a = 0.998 and fEdd = 1 are assumed to plot these reference lines. The bottom panel shows the fraction of counter-rotating accretion episodes over the total, per BH mass bin.
Current usage metrics show cumulative count of Article Views (full-text article views including HTML views, PDF and ePub downloads, according to the available data) and Abstracts Views on Vision4Press platform.
Data correspond to usage on the plateform after 2015. The current usage metrics is available 48-96 hours after online publication and is updated daily on week days.
Initial download of the metrics may take a while.