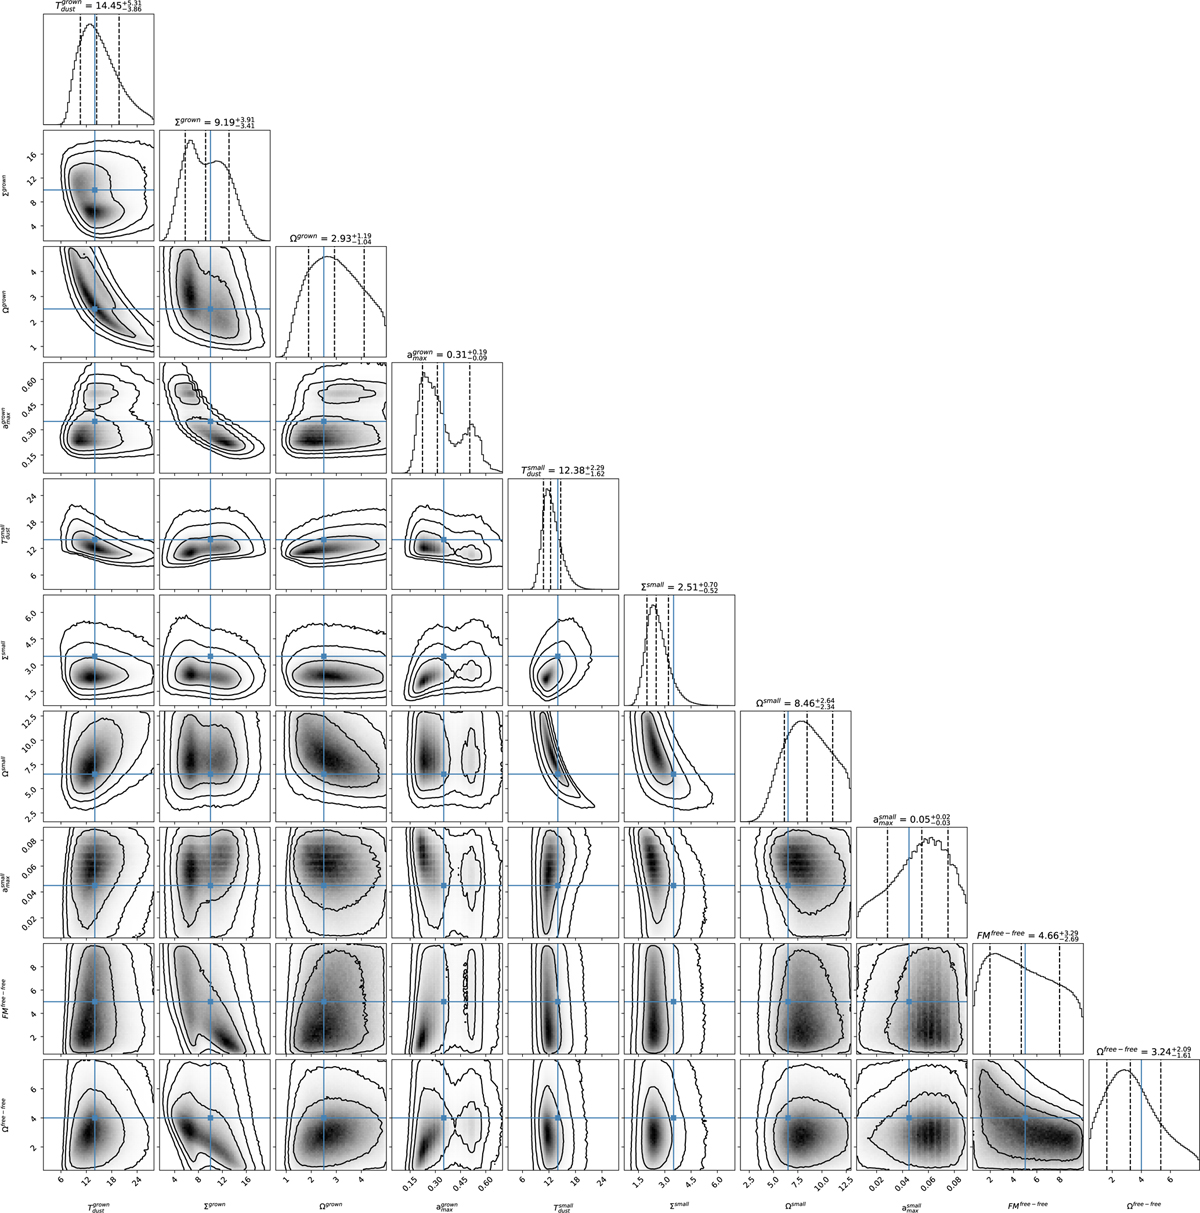
Fig. D.3
Download original image
MCMC corner plot and the posterior distributions for the free-parameters in our SED model (Section 4.1; Appendix D; Table 3). Units for all temperatures are Kelvin; units for dust column densities (Σ) are g cm–2, units for amax are millimeter; units for Ωgrown, Ωsmall, and Ωfree-free are 10–12,10–12, and 10–15 Sr, respectively; units for EM is 108 cm–6 pc. The solid blue lines show the mean initial positions of the MCMC samplers. The 2D histograms show the projected distributions of the samplers over the planes defined by two free-parameters. The 1D histograms are marginal posterior distributions of these parameters. The vertical dashed lines indicated the 16th, 50th, and 84th percentiles of the samples, respectively, which are labeled on the top of each histogram. Some spikes in the 1D histograms are due to a few samplers that the positions cannot be advanced over iterations; however, they do not seriously impact our overall interpretation.
Current usage metrics show cumulative count of Article Views (full-text article views including HTML views, PDF and ePub downloads, according to the available data) and Abstracts Views on Vision4Press platform.
Data correspond to usage on the plateform after 2015. The current usage metrics is available 48-96 hours after online publication and is updated daily on week days.
Initial download of the metrics may take a while.