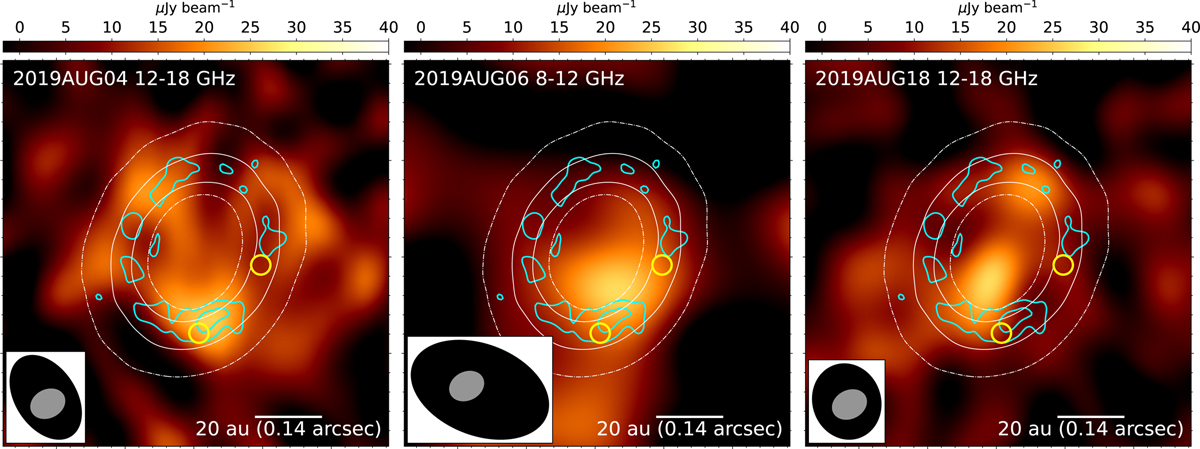
Fig. C.1
Download original image
Comparisons of the ALMA image (white contours, same as the contours presented in the left panel of Figure 1) and the JVLA images taken at various frequency bands. Color images are the X band (8–12 GHz) and Ku band (12–18 GHz) images published in Terada et al. (2023); synthesized beams are shown in the lower left in black color. Cyan contours shows the Q-fiducial image (1σ×[3, 5]); synthesized beam is shown in the lower left in gray color. Yellow circles marks the locations of the previously reported blobs A and B (Hashimoto et al. 2021).
Current usage metrics show cumulative count of Article Views (full-text article views including HTML views, PDF and ePub downloads, according to the available data) and Abstracts Views on Vision4Press platform.
Data correspond to usage on the plateform after 2015. The current usage metrics is available 48-96 hours after online publication and is updated daily on week days.
Initial download of the metrics may take a while.