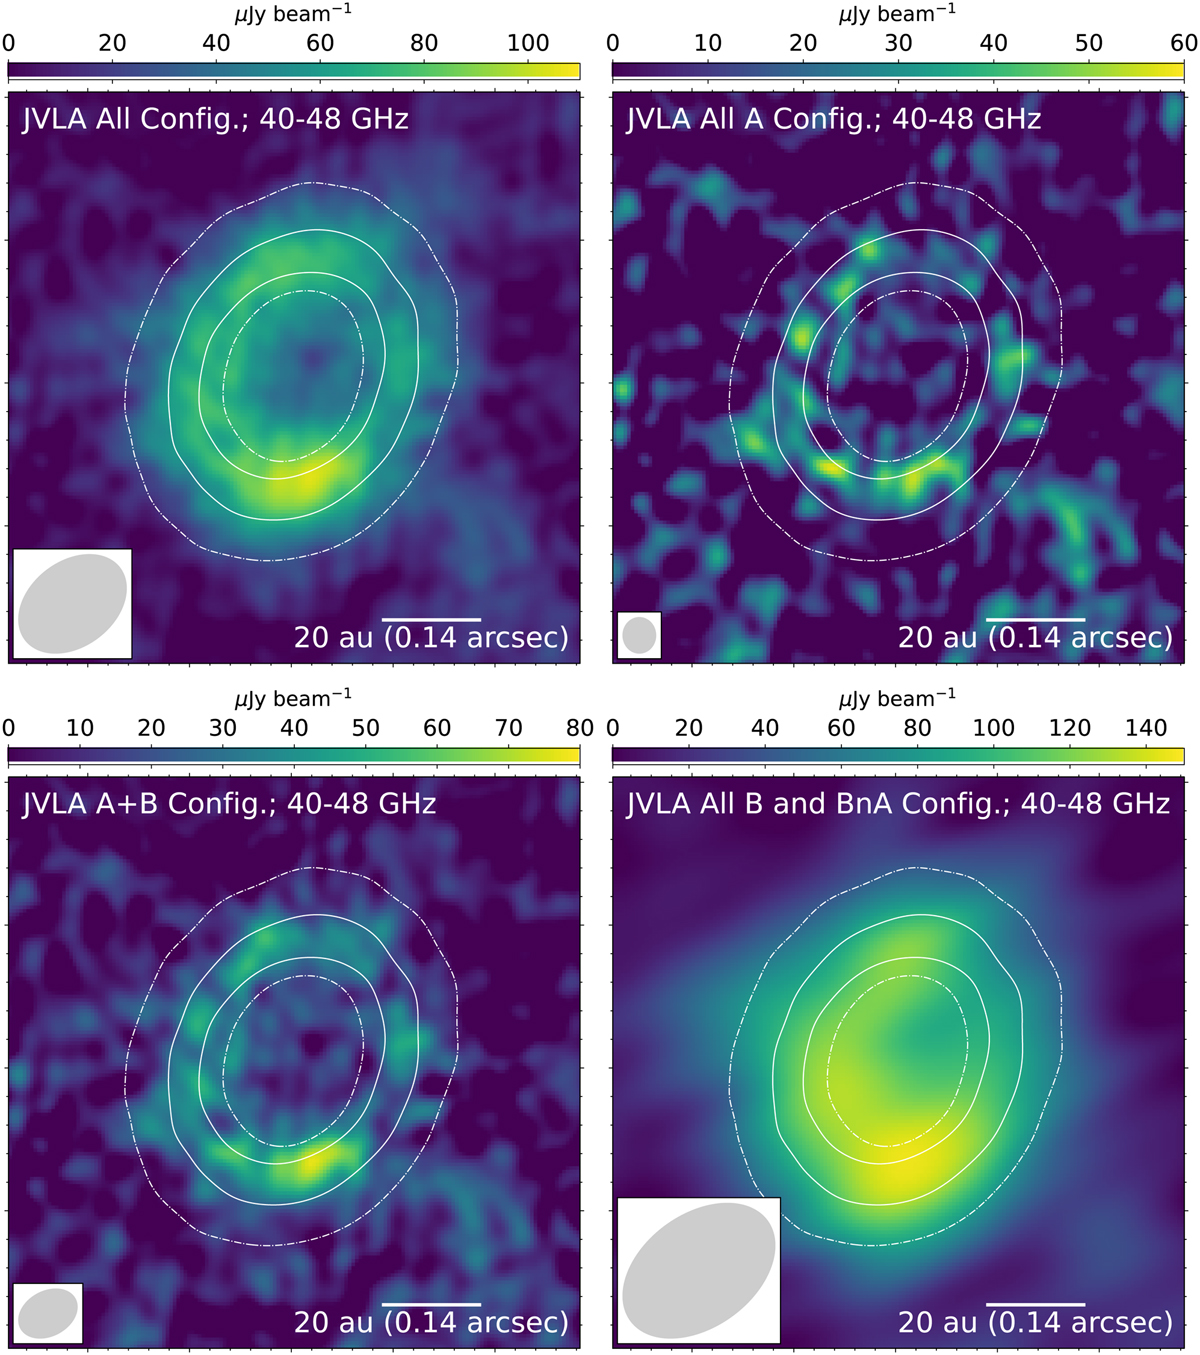
Fig. A.1
Download original image
Images on DM Tau. Top-left: JVLA Q band image produced by jointly imaging all Q band observations listed in Table 1 (Q-all image; θmaj × θmin=0″.17×0″.12; PA=−53°; RMS=8.1 µJybeam−1). Top-right: JVLA Q band image produced by jointly imaging all Q band, A array configuration observations listed in Table 1 (Q-A image; θmaj × θmin=0″.074×0″.058; PA=−63°; RMS=9.7 µJy beam−1). Bottom-left: JVLA Q band image produced by jointly imaging all Q band, B, BnA, and A array configuration observations listed in Table 1 (Q-AB image; θmaj × θmin=0″.087×0″.062; PA=−61°; RMS=10 µJy beam−1). Bottom-right: JVLA Q band image produced by jointly imaging all Q band, B and BnA array configuration observations listed in Table 1 (Q-B image; θmaj × θmin=0″.24×0″.16; PA=−54°; RMS=13 µJy beam−1). Contours in all panels are the same as those presented in Figure 1.
Current usage metrics show cumulative count of Article Views (full-text article views including HTML views, PDF and ePub downloads, according to the available data) and Abstracts Views on Vision4Press platform.
Data correspond to usage on the plateform after 2015. The current usage metrics is available 48-96 hours after online publication and is updated daily on week days.
Initial download of the metrics may take a while.