Fig. 3
Download original image
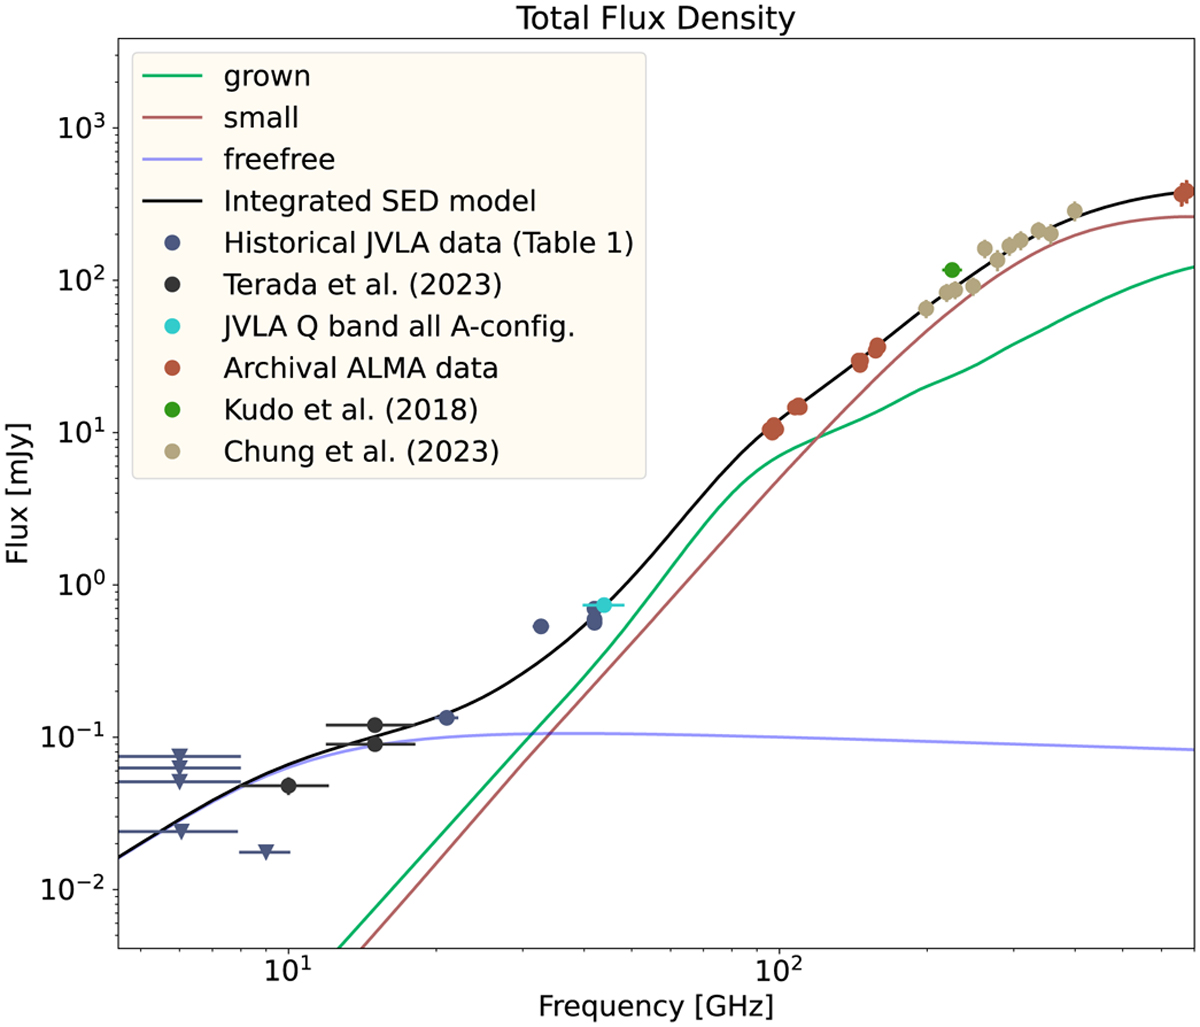
Flux densities of the DM Tau disk (λ =0.43–67 mm). Dots are the flux density measurements made from our own and the archival JVLA observations (for details see Sect. 2.1), ALMA 225 GHz measurement from Kudo et al. (2018), JVLA 8–12 GHz and 12–18 GHz measurements from Terada et al. (2023), archival ALMA Band 3, 4, and 9 observations (Table 2), and the SMA 200–400 GHz measurements quoted from Chung et al. (2023). Triangles are the 3-σ upper limits. The vertical error bars ±1σ error; the horizontal error bars show the frequency coverages of the measurements. The sizes of some symbols are larger than the error bars. Green, red, and blue lines show the flux densities of the grown dust, small dust, and free-free emission components in our best-fit model (Table 3; Sect. 4) while the black line shows the integrated flux densities of these models.
Current usage metrics show cumulative count of Article Views (full-text article views including HTML views, PDF and ePub downloads, according to the available data) and Abstracts Views on Vision4Press platform.
Data correspond to usage on the plateform after 2015. The current usage metrics is available 48-96 hours after online publication and is updated daily on week days.
Initial download of the metrics may take a while.