Fig. 2
Download original image
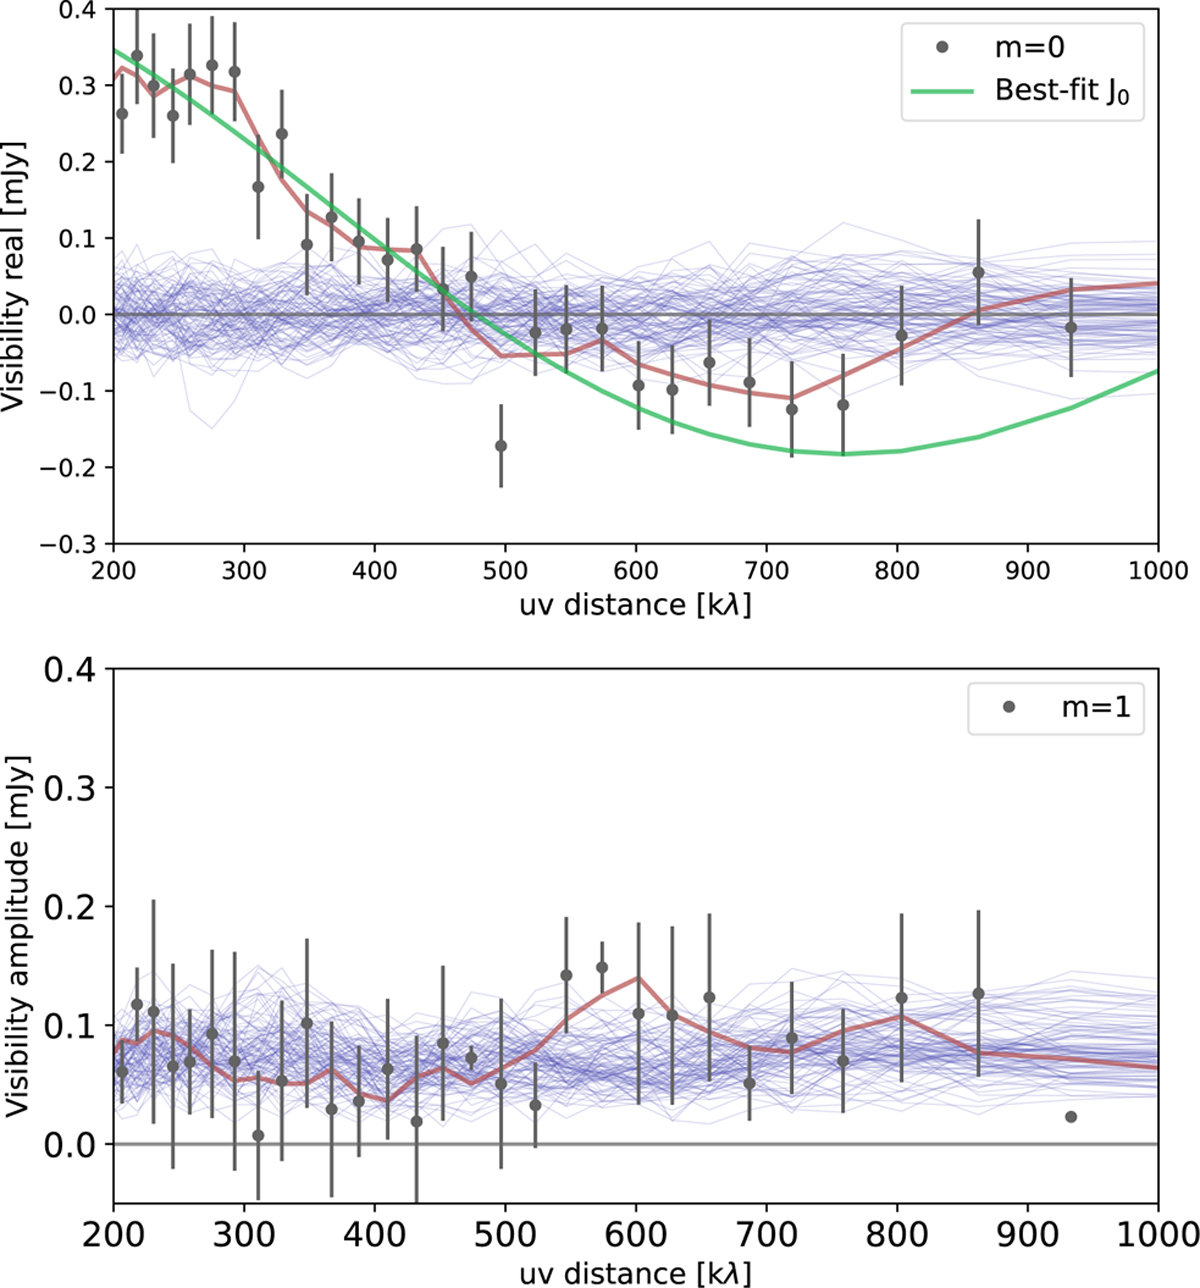
Visibility analyses for DM Tau (Sect. 3; Appendix B). Data points in the upper and lower panels show the real part of the m=0 moment (monopole) of the complex visibilities and the amplitudes of the m=1 moment of the complex visibilities, respectively. Error bars were calculated by the standard deviation at each radial bin of the uv-space. Red lines show the smoothed data points using the Savitzky-Golay filter (length of the filter window=7, order of the polynomial=2). Blue lines in each panel show 100 Savitzky–Golay filter smoothed random realization of noises (note that visibility amplitudes are positive definite). Green line in the upper panel shows the best-fit of the 0th order Bessel function of the first kind (J0).
Current usage metrics show cumulative count of Article Views (full-text article views including HTML views, PDF and ePub downloads, according to the available data) and Abstracts Views on Vision4Press platform.
Data correspond to usage on the plateform after 2015. The current usage metrics is available 48-96 hours after online publication and is updated daily on week days.
Initial download of the metrics may take a while.