Fig. 1
Download original image
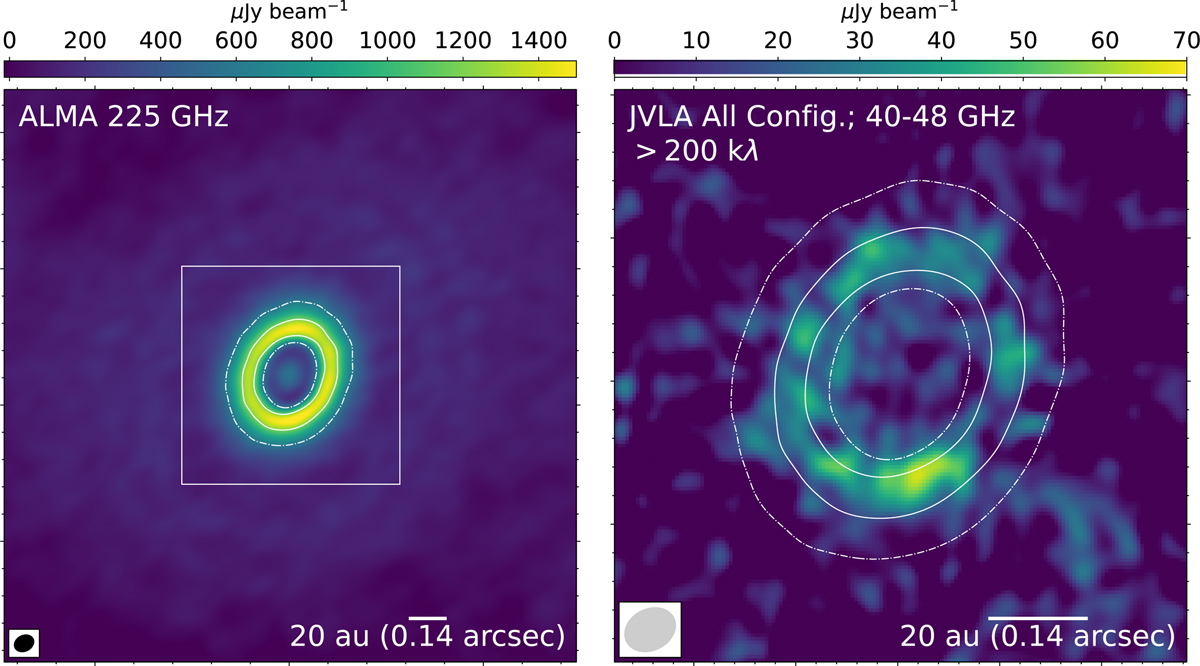
ALMA and JVLA images on DM Tau. Left: previously published ALMA 225 GHz (~1.3 mm) continuum image (color and contours; Kudo et al. 2018; Hashimoto et al. 2021) smoothed to the synthesized beam of the JVLA image in the right panel. Dash-dotted and solid contours are 600 and 1200 µJy beam−1, respectively. Right: JVLA 40–18 GHz (~7 mm) continuum image (color; θmaj × θmin=0″.074×0″.058, PA= −63°; RMS= 11 µJy beam−1) in the region enclosed by the white box in the left panel. This image was created by jointly imaging all Q band observations listed in Table 1, limiting the wv-distance to >200 kλ. The images made with other combination of array configurations are provided in Fig. A.1. Contours are identical to those plotted in the left panel. The synthesized beams of the ALMA (black) and JVLA images (gray) are plotted in the bottom-left.
Current usage metrics show cumulative count of Article Views (full-text article views including HTML views, PDF and ePub downloads, according to the available data) and Abstracts Views on Vision4Press platform.
Data correspond to usage on the plateform after 2015. The current usage metrics is available 48-96 hours after online publication and is updated daily on week days.
Initial download of the metrics may take a while.