Fig. 3
Download original image
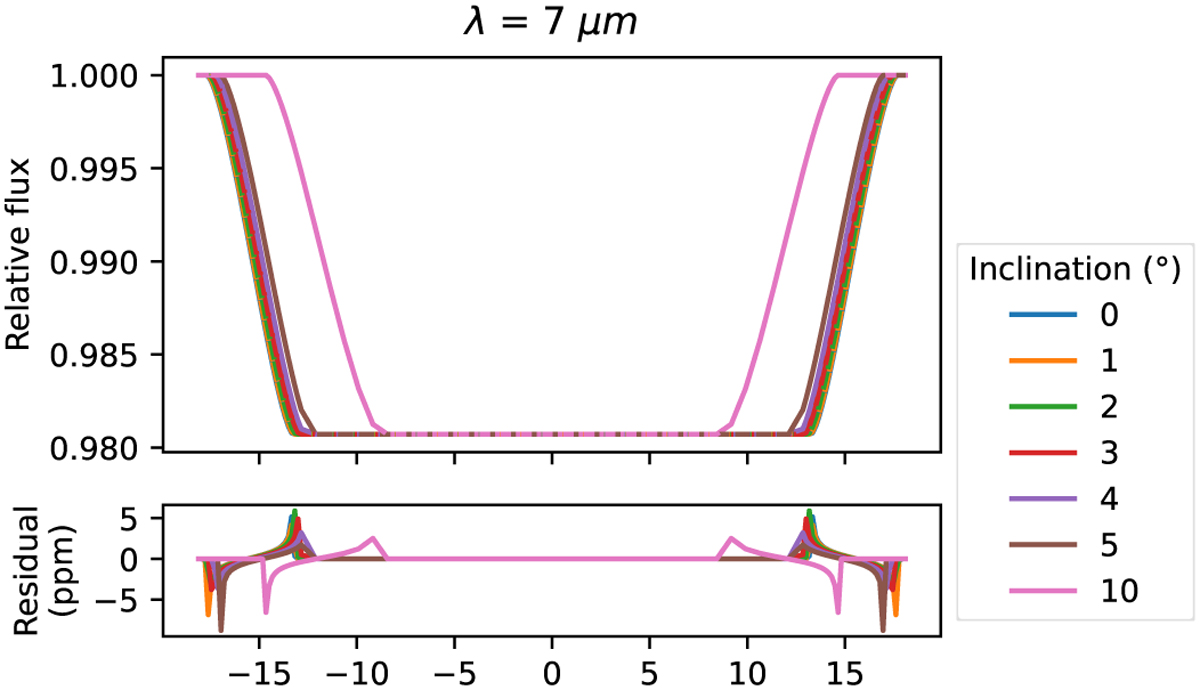
Relative flux (Eq. (2)) at a wavelength, λ = 7μm, of the spherical approximation (batman) compared to the diffuse opacity of a 1D (Table 1) atmospheric simulation (Pytmosph3R) (see Fig. 2 for the schematics). The effect is similar in the case of a 2D day–night (Table 1) simulation (Pytmosph3R) without rotation (i.e., N𝒯 = 1). The same effect holds true in 3D cases, since the opacity of each case will decrease with the altitude, although it will be dominated by other effects.
Current usage metrics show cumulative count of Article Views (full-text article views including HTML views, PDF and ePub downloads, according to the available data) and Abstracts Views on Vision4Press platform.
Data correspond to usage on the plateform after 2015. The current usage metrics is available 48-96 hours after online publication and is updated daily on week days.
Initial download of the metrics may take a while.