Fig. C.2
Download original image
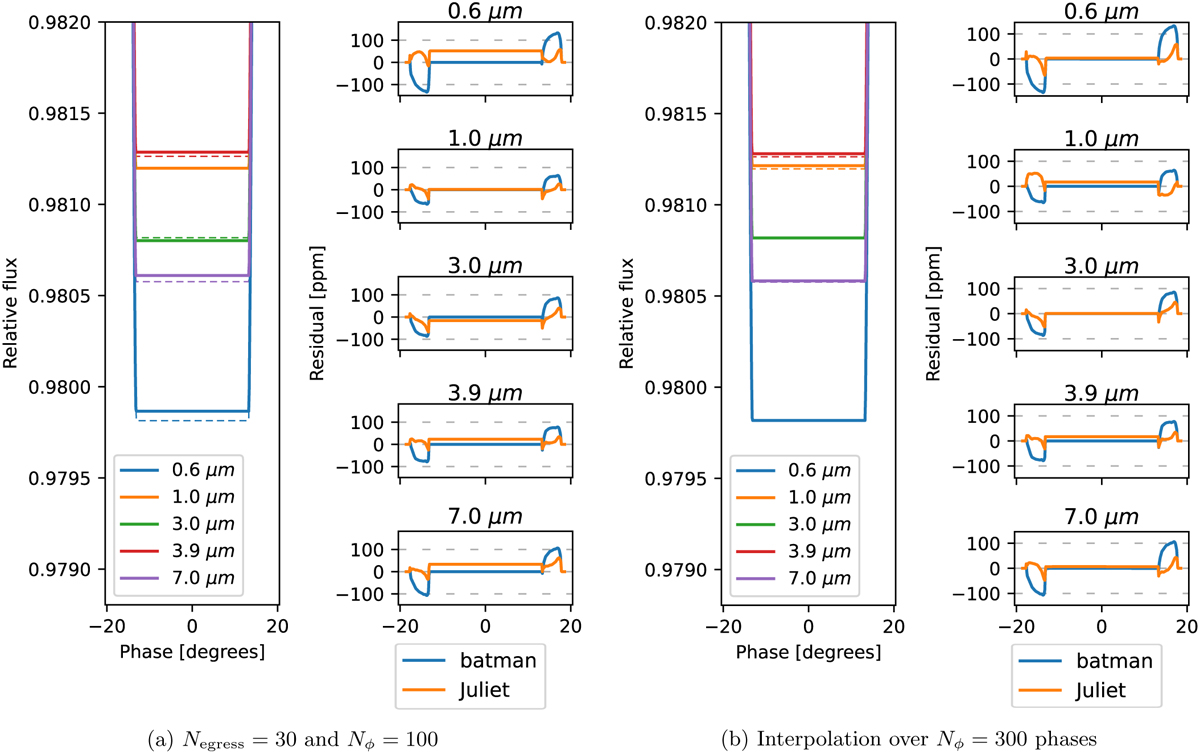
Comparison between Pytmosph3R, batman (T0 = 0), and Juliet (values retrieved in Fig.C.1). For each subfigure: Left: Light curves generated by Pytmosph3R (dashed line) compared to Juliet (solid line). Right: Residuals of batman (blue) and Juliet (orange) compared to Pytmosph3R. The residual of Juliet is lower on average than that of batman, mainly because of the shift in T0. Using Negress = 30 and Nϕ = 100 leads to a statistical overrepresentation of the egress or ingress in the retrieval, which can be corrected using an interpolation over Nϕ = 300 phases (see Fig. C.2).
Current usage metrics show cumulative count of Article Views (full-text article views including HTML views, PDF and ePub downloads, according to the available data) and Abstracts Views on Vision4Press platform.
Data correspond to usage on the plateform after 2015. The current usage metrics is available 48-96 hours after online publication and is updated daily on week days.
Initial download of the metrics may take a while.