Fig. B.1
Download original image
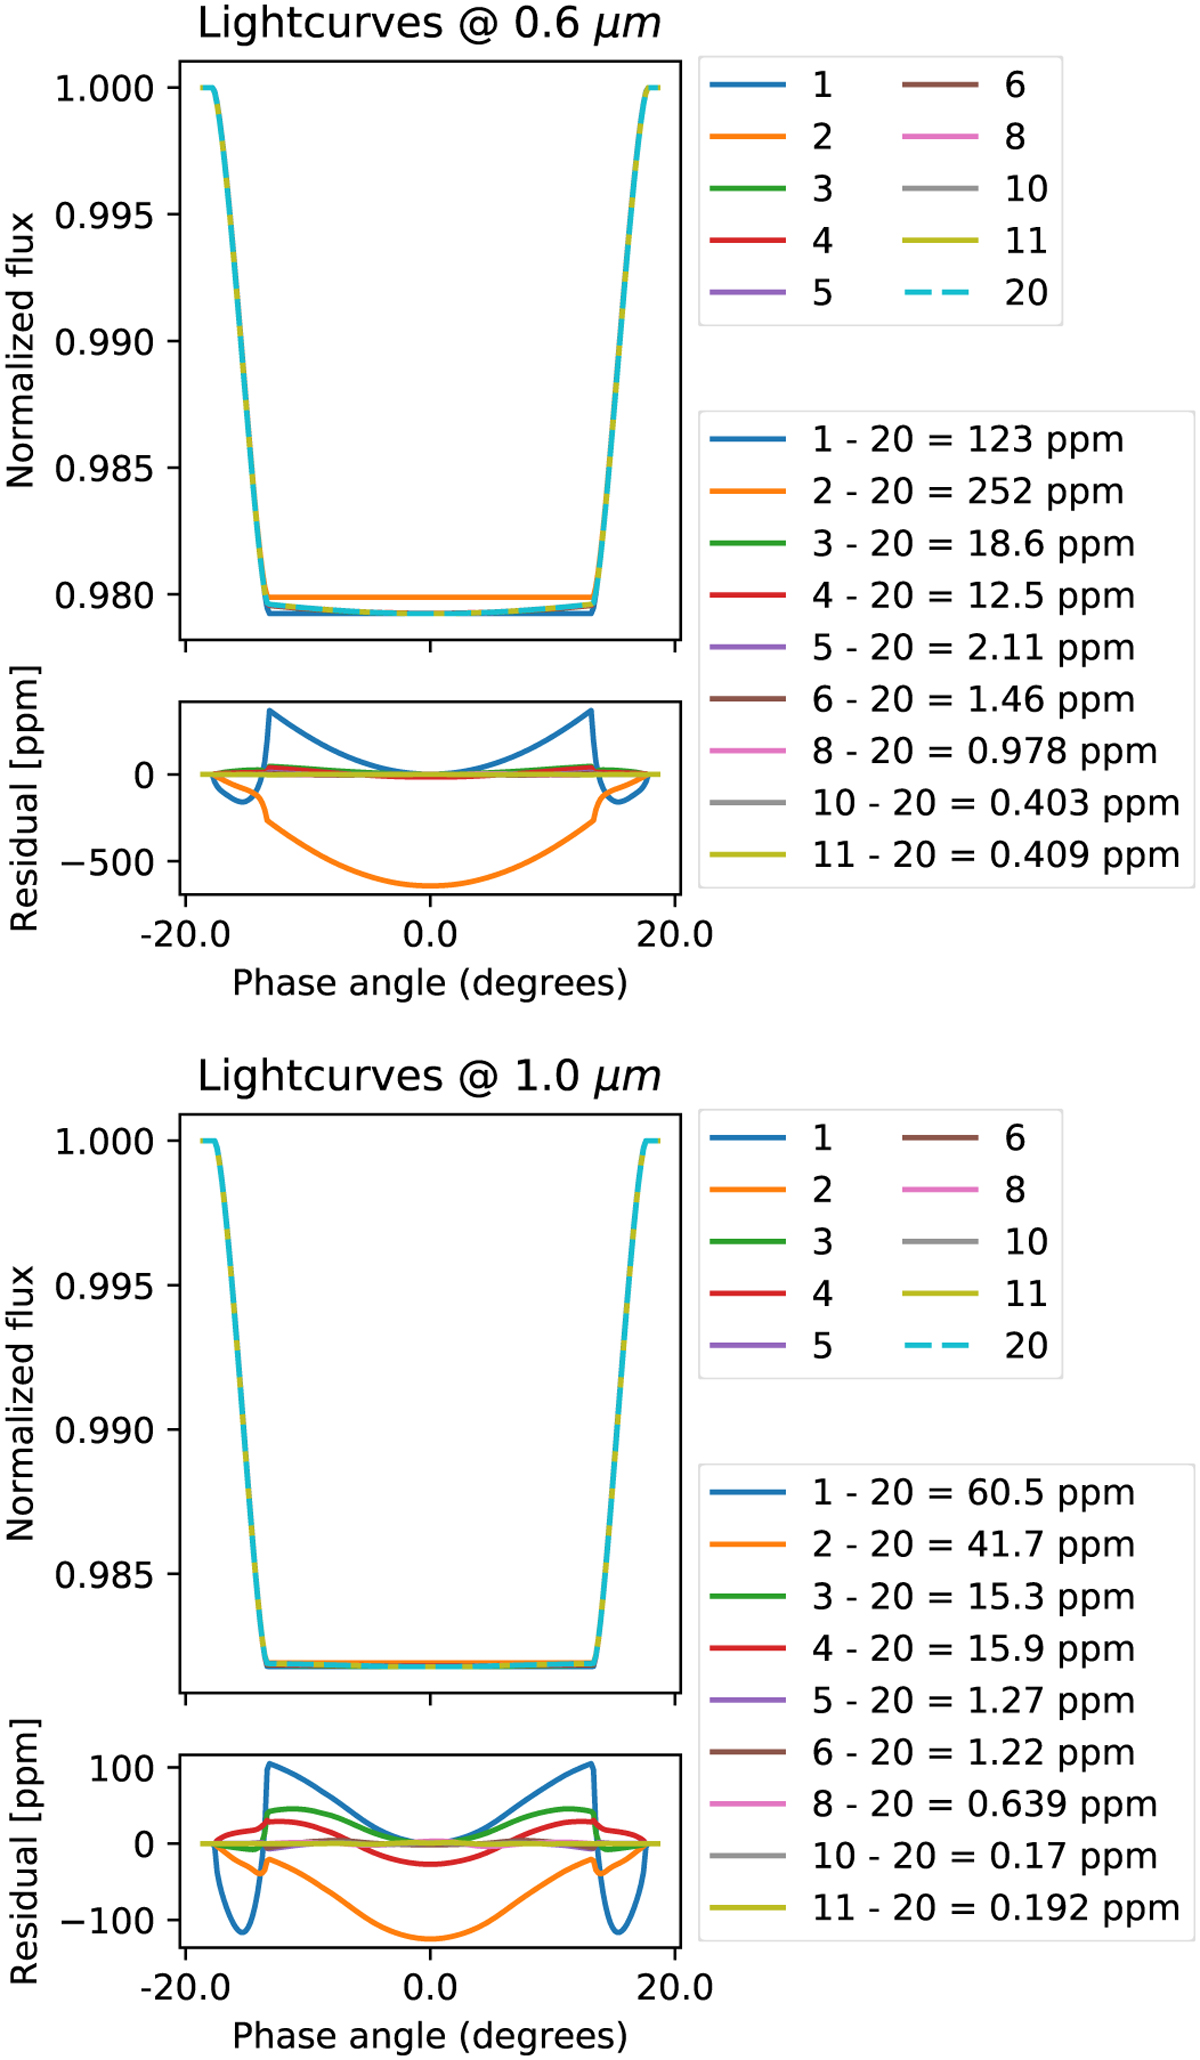
Increasing the number of steps in which we compute the transmittance increases the accuracy of the computed light curve. The legend indicates the number of transmittance maps, N𝒯, used, as well as their difference to N𝒯 = 20 and the corresponding standard deviation. The standard deviation for N𝒯 = 8 is less than 1 ppm and is therefore an acceptable number compared to current instrumental errors (Rustamkulov et al. 2023). The 2D study case was used for this experiment (Table1).
Current usage metrics show cumulative count of Article Views (full-text article views including HTML views, PDF and ePub downloads, according to the available data) and Abstracts Views on Vision4Press platform.
Data correspond to usage on the plateform after 2015. The current usage metrics is available 48-96 hours after online publication and is updated daily on week days.
Initial download of the metrics may take a while.