Fig. A.2
Download original image
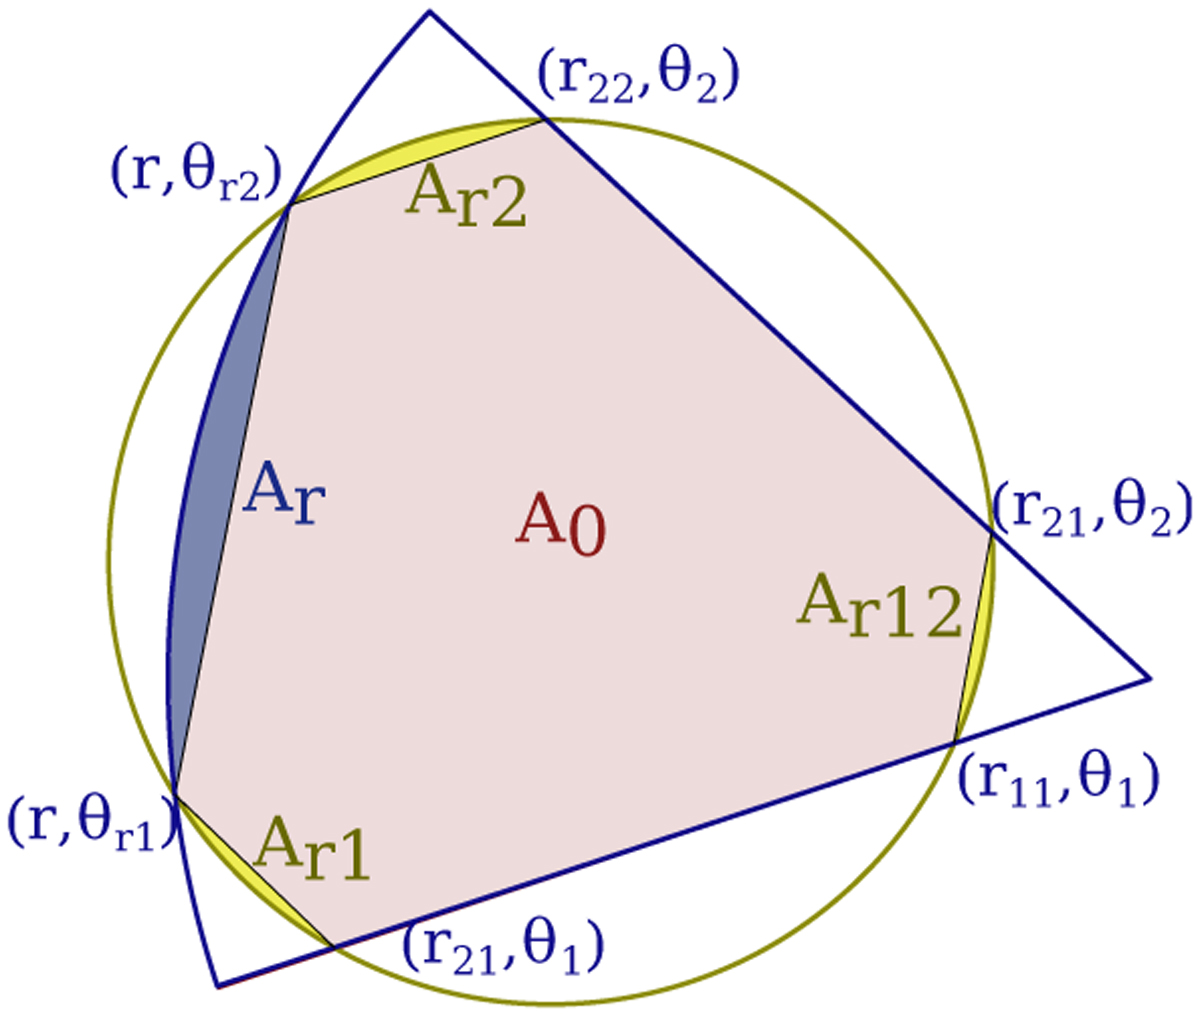
Intersection of one sector (r, θ1, θ2) of the transmittance grid (boundaries in blue) with the star (boundaries in yellow). The intersection area can be subdivided into the sum of circular segments (yellow when the circle is the star; blue when the circle is the planet) and triangles (subparts of A0, in red). Here, the maximum number of intersections has been displayed. Fig. A.3 shows examples of cases with fewer intersections.
Current usage metrics show cumulative count of Article Views (full-text article views including HTML views, PDF and ePub downloads, according to the available data) and Abstracts Views on Vision4Press platform.
Data correspond to usage on the plateform after 2015. The current usage metrics is available 48-96 hours after online publication and is updated daily on week days.
Initial download of the metrics may take a while.