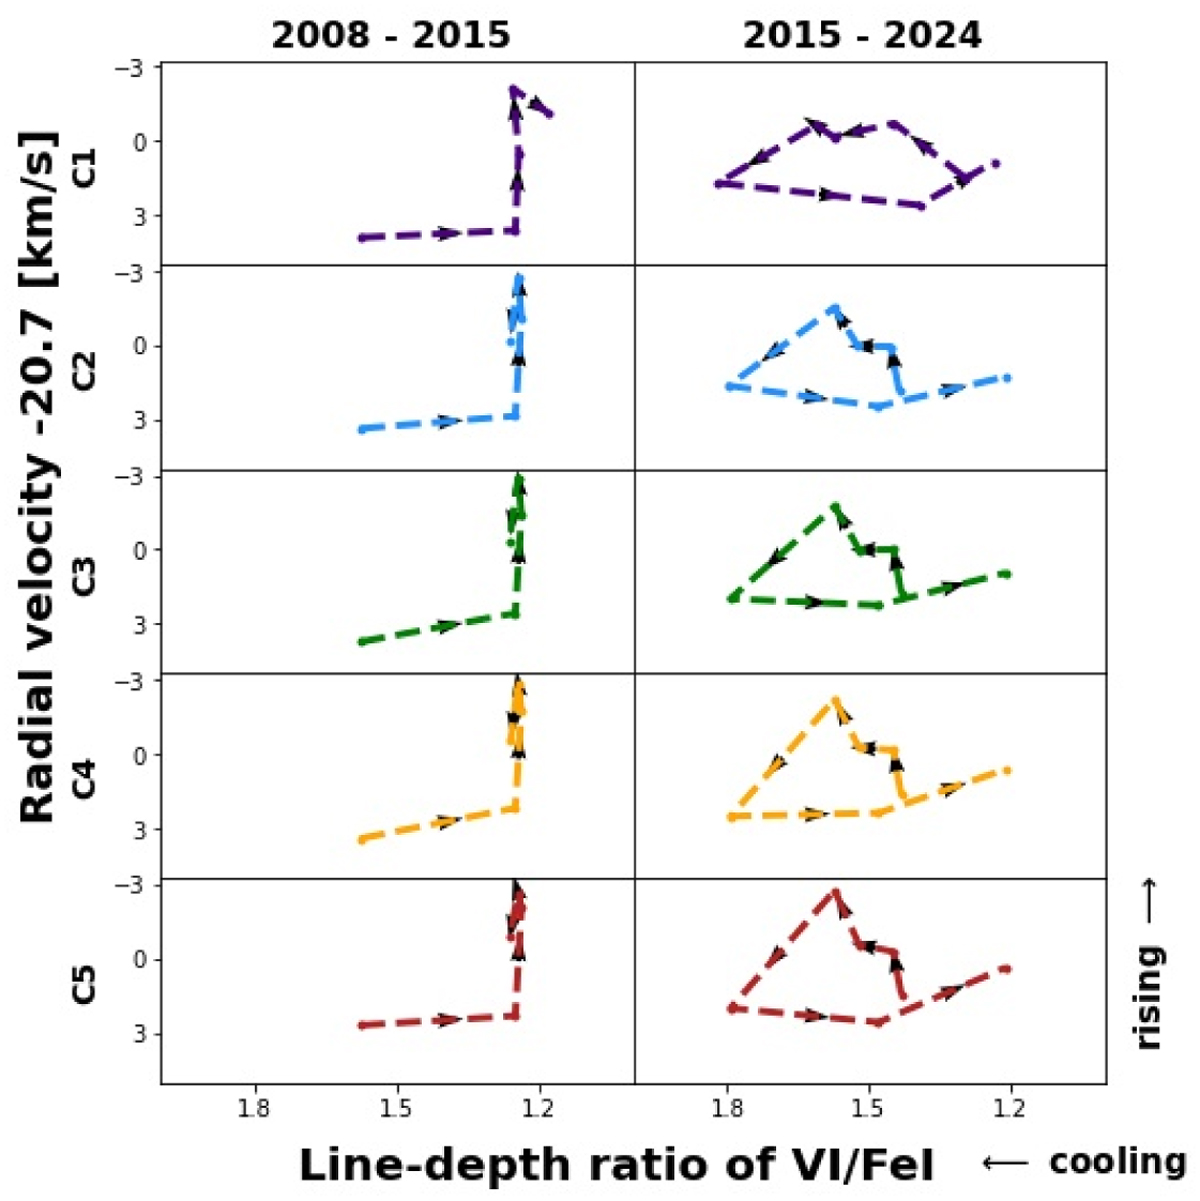
Fig. A.4
Download original image
Phase shift between variations of velocity and temperature forms hysteresis loops. The loops are shown for approximate LSP cycles and plotted for different layers of the photosphere. The values were binned in 400 d intervals. The shape of the loop of the first cycle (left panels) is affected by data sampling. Nonetheless, the first cycle also suggests that material is returning to its starting position (except in layer C1).
Current usage metrics show cumulative count of Article Views (full-text article views including HTML views, PDF and ePub downloads, according to the available data) and Abstracts Views on Vision4Press platform.
Data correspond to usage on the plateform after 2015. The current usage metrics is available 48-96 hours after online publication and is updated daily on week days.
Initial download of the metrics may take a while.