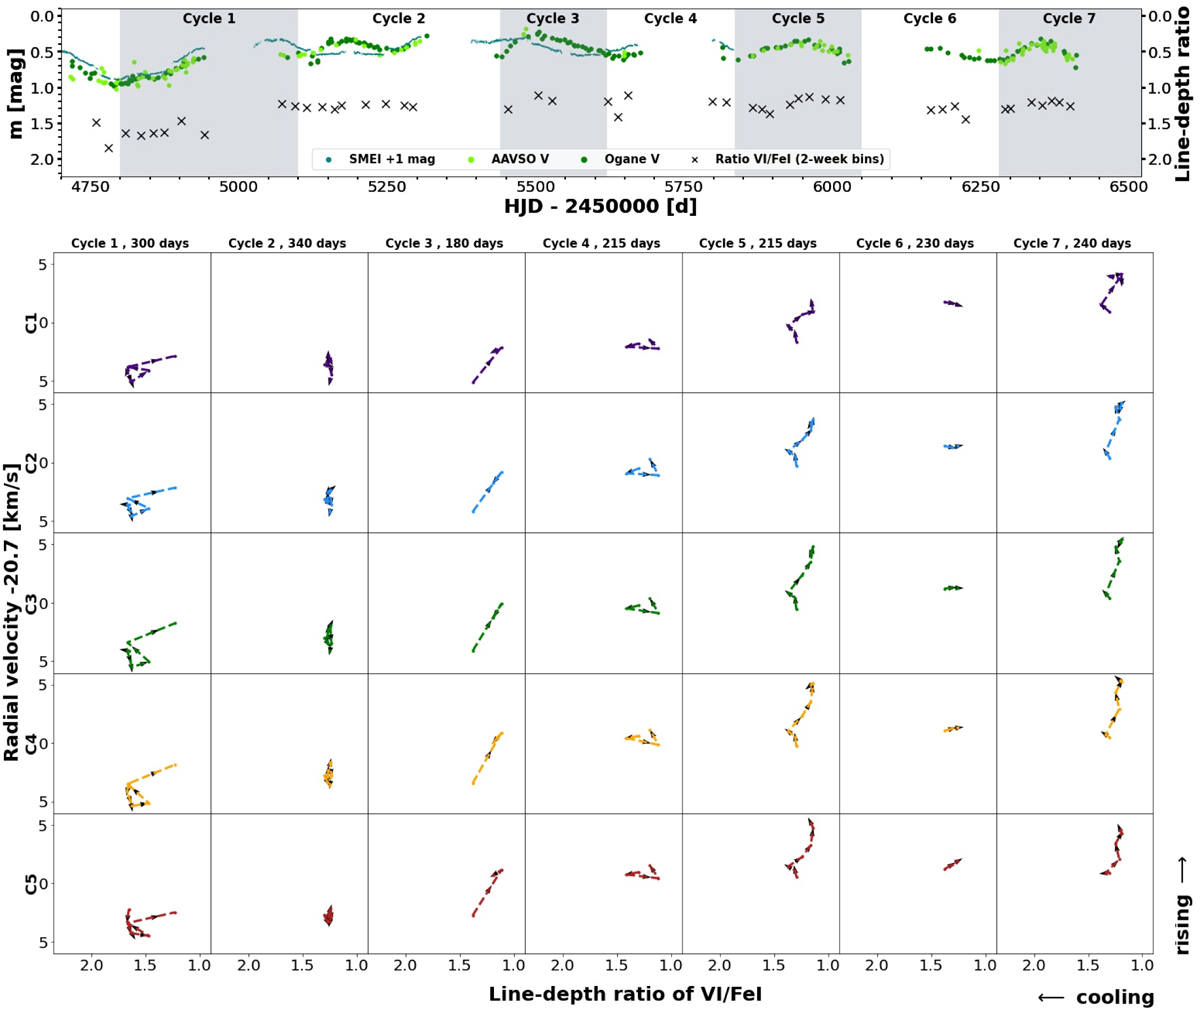
Fig. A.1
Download original image
Hysteresis loops for photometric cycles. Upper panel: Estimated photometric cycles along with the line-depth ratios of VI and Fe I. The ratios are determined from the spectra. Consequently, the ratios also show which part of a photometric cycle is covered by the data. Lower panels: Hysteresis loops relate the phase shift between the variations of velocity and temperature. To demonstrate the evolution of material in atmospheric layers more clearly, the values were binned in two-week intervals. Most cycles lack significant parts of the loops due to an insufficient number of measurements (especially in the first half of the data) and observation gaps; therefore, in many cases full loops are not observed. The black arrows indicate the direction of a loop, which almost always is as we would expect, that is, counterclockwise. Continued in Fig. A.2.
Current usage metrics show cumulative count of Article Views (full-text article views including HTML views, PDF and ePub downloads, according to the available data) and Abstracts Views on Vision4Press platform.
Data correspond to usage on the plateform after 2015. The current usage metrics is available 48-96 hours after online publication and is updated daily on week days.
Initial download of the metrics may take a while.