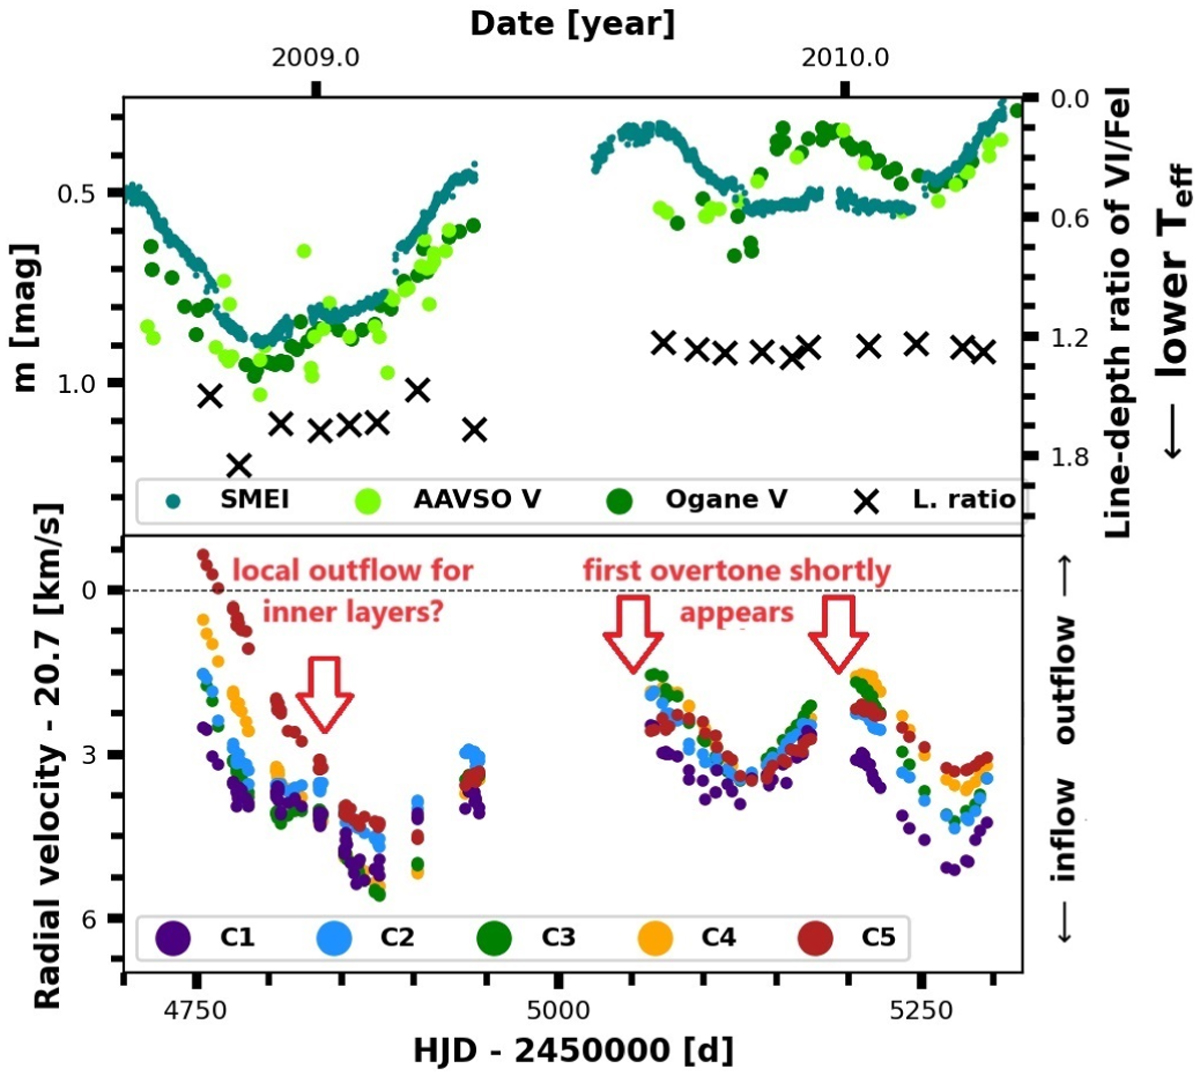
Fig. 5

Download original image
Detail from Fig. 1 showing presence of low-order overtones long before the dimming. The upper panel shows variability of brightness and temperature; lower panel shows variability of velocity. The second and third red arrows denote the estimated times of maxima, which are delayed only by about 150 days from each other. The first red arrow denotes a possible local maximum outflow velocity of inner layers (C1–C3), while the two outermost layers appear not to have a local maximum of velocity. Thus, the behavior of the atmospheric layers slightly resembles the aftermath of dimming. If we had more data, we could see for how long the low-order overtones remained prominent.
Current usage metrics show cumulative count of Article Views (full-text article views including HTML views, PDF and ePub downloads, according to the available data) and Abstracts Views on Vision4Press platform.
Data correspond to usage on the plateform after 2015. The current usage metrics is available 48-96 hours after online publication and is updated daily on week days.
Initial download of the metrics may take a while.


