Fig. 4
Download original image
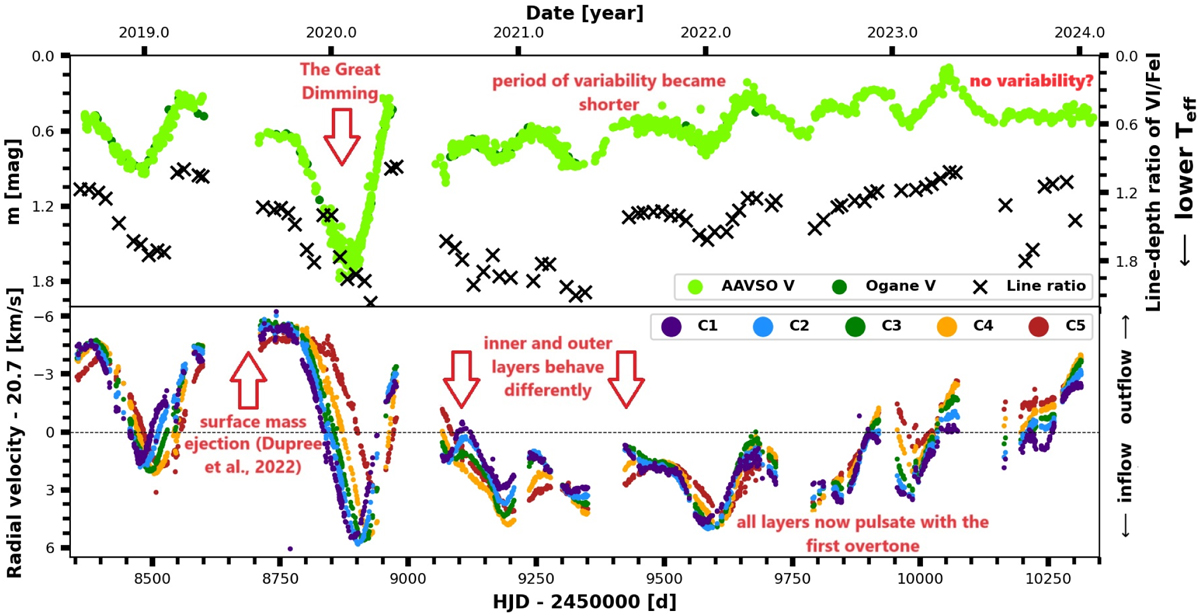
Detailed view of Great Dimming and its aftermath from Fig. 2. The upper panel shows variability of brightness and temperature; the lower panel shows variability of velocity. The first red arrow denotes the unusual outflow that lasted ~200 days. During this outflow, the ejection of material as proposed by Dupree et al. (2022) could easily happen. What followed were extreme infall velocities, while the maximum infall velocities of inner layers were higher than those of upper layers, which is unprecedented in the data. In the aftermath of the dimming and the second shockwave, the outer and inner layers behaved differently. Inner layers (C1–C3) exhibited a separation of local outflow maxima corresponding to the first overtone (the third and fourth red arrows), whereas the outer layers appeared to have a substantially longer separation, likely corresponding to the FM. Since the beginning of 2022, the layers appear more synchronized with each other again, but the dominant mode of pulsations is now the first overtone.
Current usage metrics show cumulative count of Article Views (full-text article views including HTML views, PDF and ePub downloads, according to the available data) and Abstracts Views on Vision4Press platform.
Data correspond to usage on the plateform after 2015. The current usage metrics is available 48-96 hours after online publication and is updated daily on week days.
Initial download of the metrics may take a while.