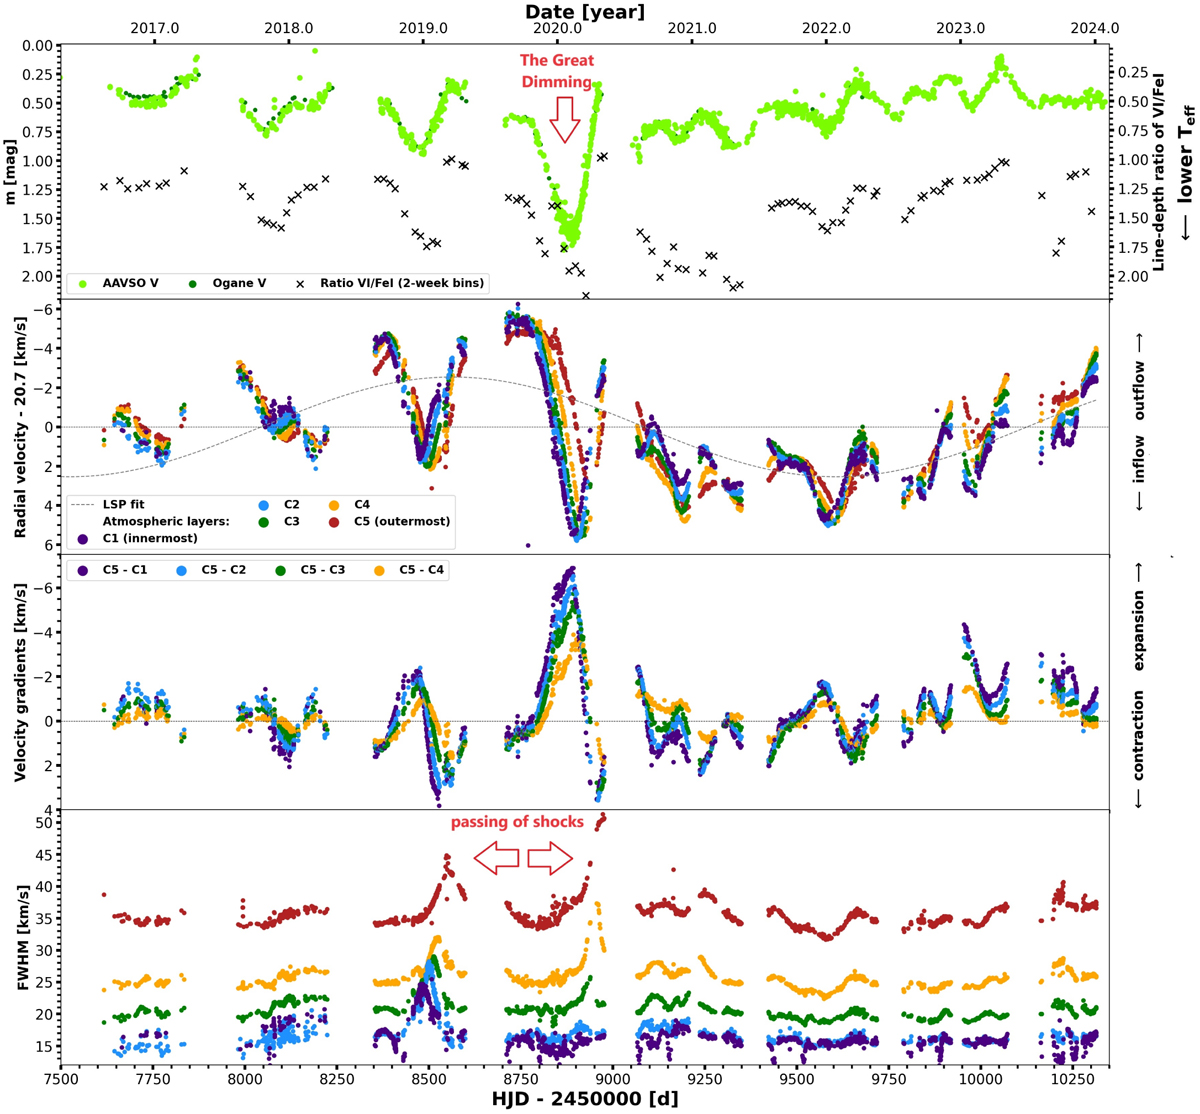
Fig. 2
Download original image
Same as Fig. 1, but for 2016–2024. First panel: light curve shows historical Great Dimming. Second panel: prior to Dimming, we can see a major long-lasting outflow velocity, followed by extreme infall velocity. Third panel: during Great Dimming, gradients were uniquely negative, suggesting a strong expansion of the inner layers. Fourth panel: before and after Dimming, there are two significant peaks in the FWHMs, while the latter peak was much stronger. Both peaks are caused by a passing shockwave.
Current usage metrics show cumulative count of Article Views (full-text article views including HTML views, PDF and ePub downloads, according to the available data) and Abstracts Views on Vision4Press platform.
Data correspond to usage on the plateform after 2015. The current usage metrics is available 48-96 hours after online publication and is updated daily on week days.
Initial download of the metrics may take a while.