Fig. 1
Download original image
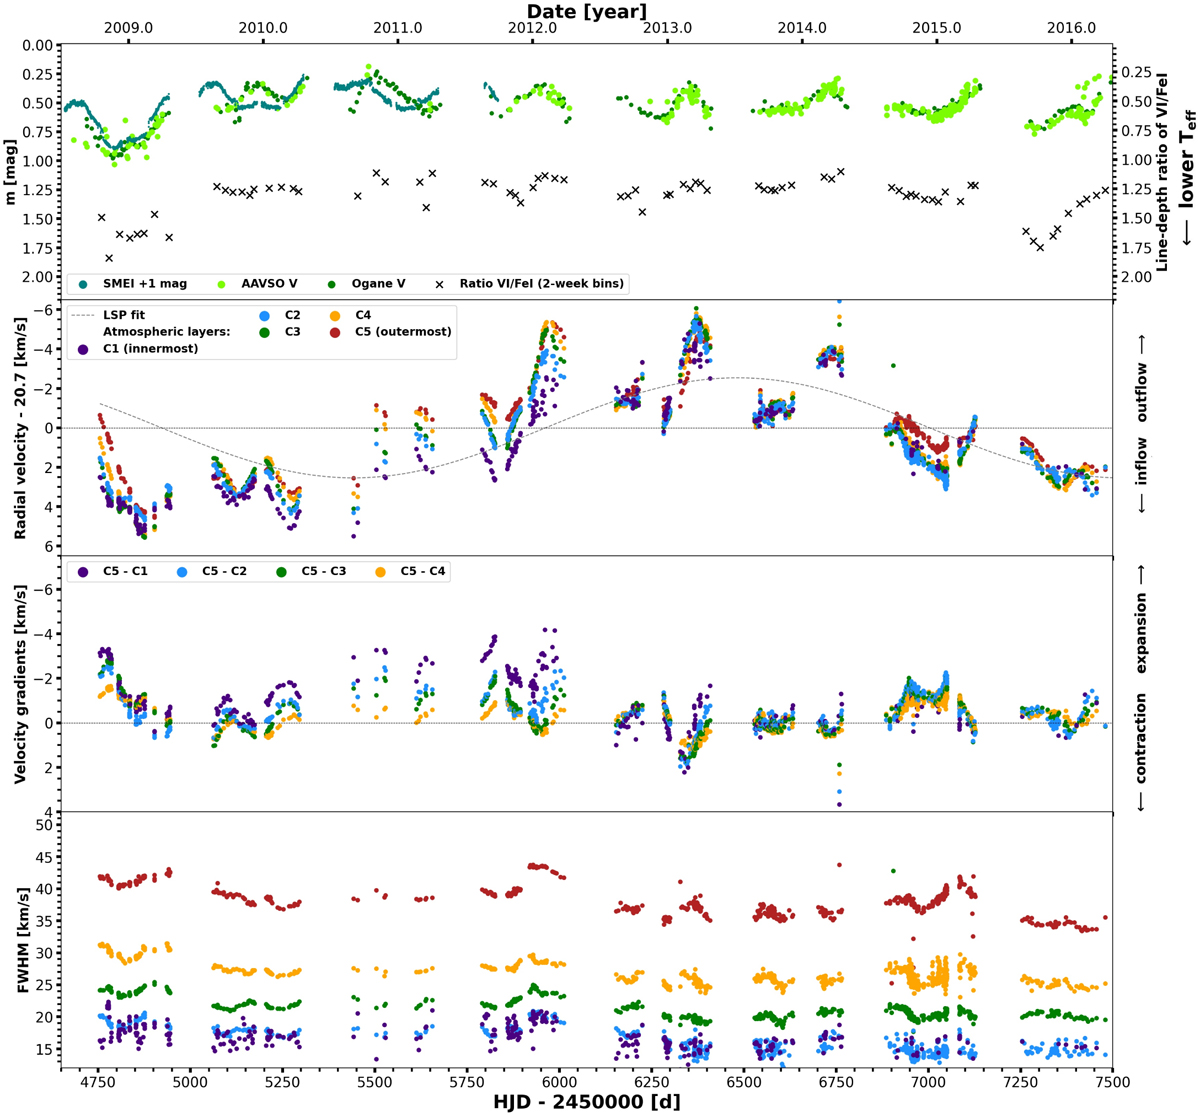
Variability of Betelgeuse from 2008–2016 First panel: light curve comprising of data from AAVSO, Ogane, and SMEI. Temperature is also included via the line-depth ratio of VI and Fe I. Second panel: radial velocity plot determined from STELLA spectra. The spectra were cross-correlated with five masks corresponding to five different layers of photosphere. The same color-coding is applied in the fourth panel. The velocity of the center of mass (20.7 km s−1) was subtracted. Both main periods, the FM and LSP, are clearly evident in the data, while we can also see the presence of higher overtones of the FM period between years 2009 and 2010. Third panel: gradients of radial velocity from masks in second panel. At most times the gradients are not very high. Fourth panel: FWHMs of CCFs. The FWHMs are correlated with the variability of the star, to a certain extent.
Current usage metrics show cumulative count of Article Views (full-text article views including HTML views, PDF and ePub downloads, according to the available data) and Abstracts Views on Vision4Press platform.
Data correspond to usage on the plateform after 2015. The current usage metrics is available 48-96 hours after online publication and is updated daily on week days.
Initial download of the metrics may take a while.