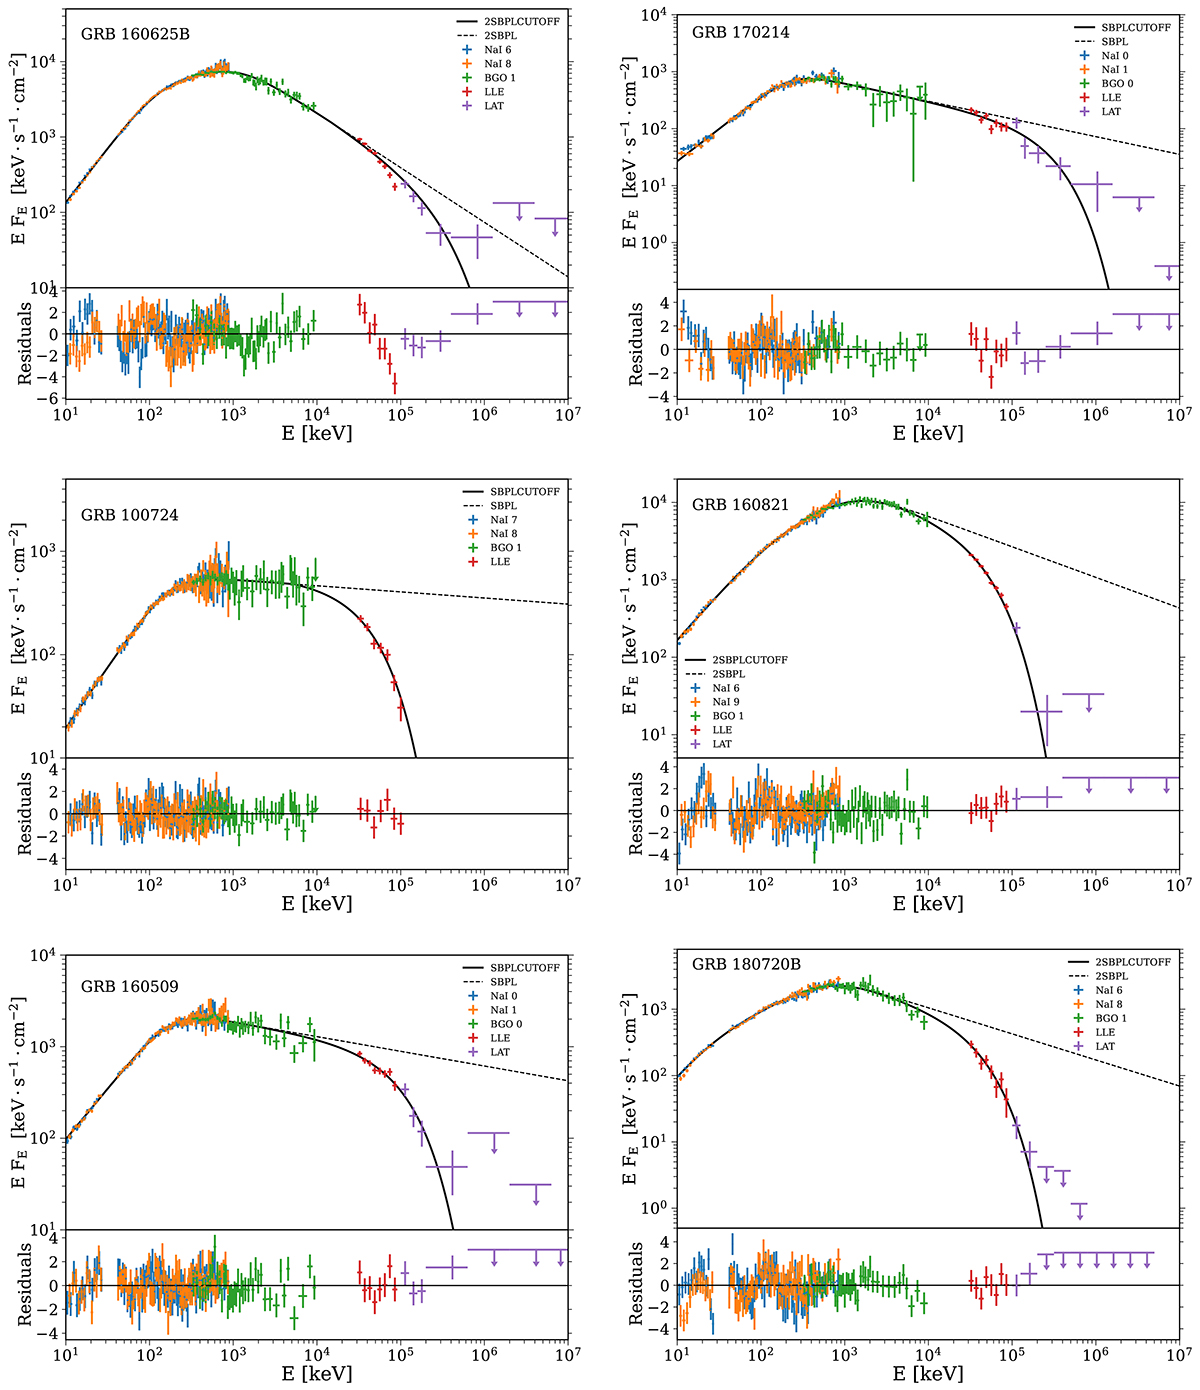
Fig. A.1.
Download original image
Time-integrated spectra of the GRBs showing the presence of an exponential cutoff at high energies, i.e., those that are best fitted by either the SBPLCUTOFF or 2SBPLCUTOFF function (solid line), excluding GRB 140206, whose spectrum has already been reported in Fig. 3. The best-fit values of the corresponding models are reported in Table 2. For each plot, data correspond to the signal detected from 10 keV to 10 GeV by the different instruments on board Fermi (color-coded as shown in the legend). Data have been rebinned for graphical purposes.
Current usage metrics show cumulative count of Article Views (full-text article views including HTML views, PDF and ePub downloads, according to the available data) and Abstracts Views on Vision4Press platform.
Data correspond to usage on the plateform after 2015. The current usage metrics is available 48-96 hours after online publication and is updated daily on week days.
Initial download of the metrics may take a while.