Fig. 8.
Download original image
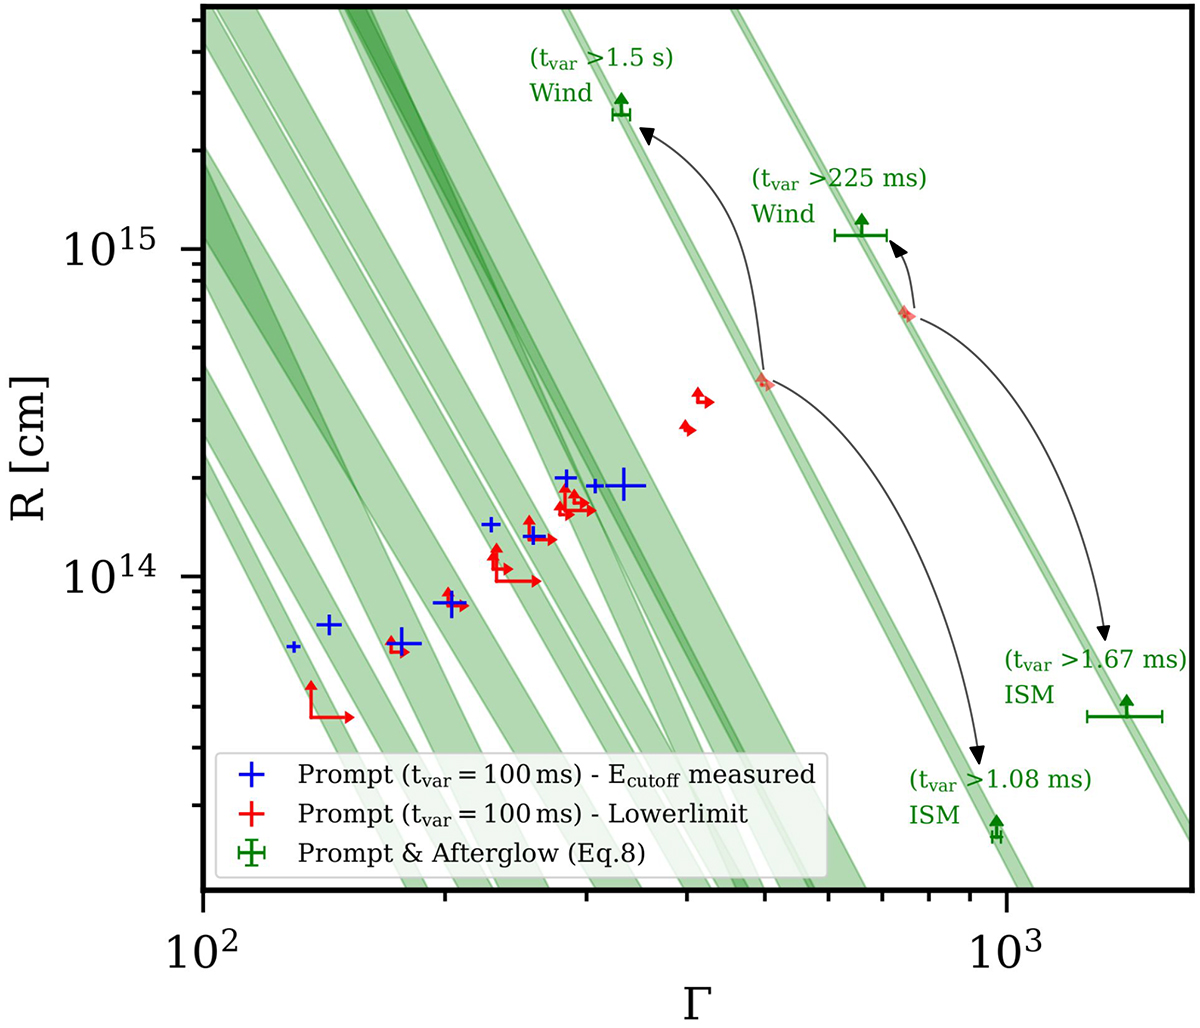
Constraints on the bulk Lorentz factor Γ and distance R of the emitting region from the central engine, for the 22 bright GRBs analyzed in this work. The measured values (blue crosses) or lower limits (red arrows) on Γ, and consequently on R (assuming tvar = 100 ms), are derived according to the presence or absence of a high-energy cutoff in the spectrum, respectively. For each GRB with a measured value of Γ, the green stripes represent the region of the parameter space allowed by the compactness argument for any given Γ, using only the prompt spectral properties and following Eq. (8). The combination of the information from the prompt and the afterglow, when available, allows us to break the degeneracy and better constrain the distance R. The four black arrows represent the cases of GRB 080916 and GRB 110731, where an independent estimate of Γ from the afterglow onset was taken from Ghirlanda et al. (2018), allowing to put constraints on the distance R. Corresponding lower limits on variability timescales are provided for each case. Each error bar represents the 1-σ error on measurements.
Current usage metrics show cumulative count of Article Views (full-text article views including HTML views, PDF and ePub downloads, according to the available data) and Abstracts Views on Vision4Press platform.
Data correspond to usage on the plateform after 2015. The current usage metrics is available 48-96 hours after online publication and is updated daily on week days.
Initial download of the metrics may take a while.