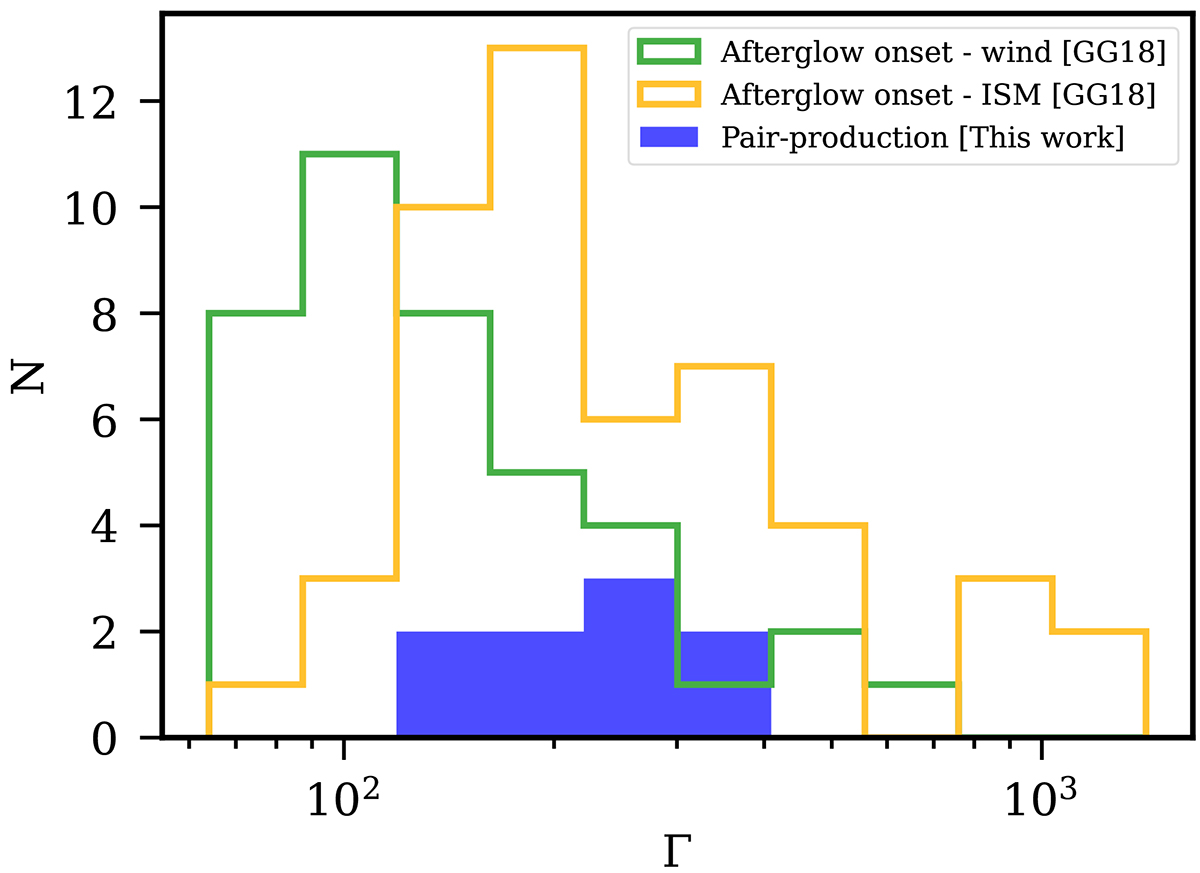
Fig. 7.

Download original image
Comparison of the distributions of bulk Lorentz factors of GRBs obtained from independent methods. The blue-filled histogram represents the distribution of Γ values derived in this work from the pair-production opacity argument applied to the prompt spectra of 9 GRBs showing a cutoff. The empty histograms show the distributions of Γ values derived from the measurement of the afterglow onset time for a sample of 50 GRBs, as reported in Ghirlanda et al. (2018). The orange histogram represents the values of the bulk Lorentz factor derived assuming a constant medium density, while the green histogram refers to the wind-like medium case. These distributions are built taking into account measurements only (not lower limits), for both methods.
Current usage metrics show cumulative count of Article Views (full-text article views including HTML views, PDF and ePub downloads, according to the available data) and Abstracts Views on Vision4Press platform.
Data correspond to usage on the plateform after 2015. The current usage metrics is available 48-96 hours after online publication and is updated daily on week days.
Initial download of the metrics may take a while.


