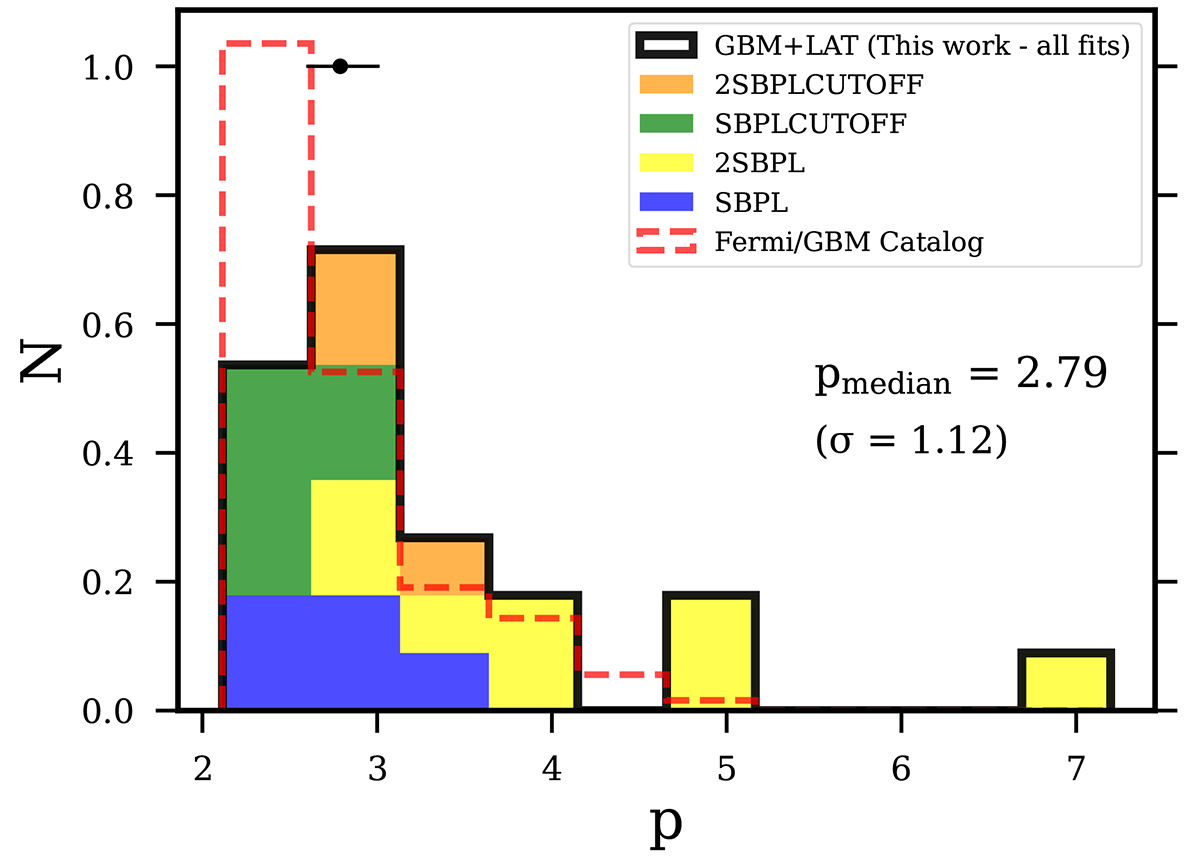
Fig. 6.
Download original image
Distribution of the slope p of the nonthermal population of accelerated particles for the sample of 22 GRBs analyzed in this work. This distribution has been derived from the β distribution shown in Fig. 4, by using the relation p = −2 − 2β or, equivalently, p = 2βe (i.e., assuming synchrotron emission in the fast cooling regime). The median value of p along with its error bar on p values are represented with the black dot and solid line, respectively. For comparison, the distribution of p derived for the Fermi/GBM catalog bursts under the same assumption is also plotted (red dashed histogram).
Current usage metrics show cumulative count of Article Views (full-text article views including HTML views, PDF and ePub downloads, according to the available data) and Abstracts Views on Vision4Press platform.
Data correspond to usage on the plateform after 2015. The current usage metrics is available 48-96 hours after online publication and is updated daily on week days.
Initial download of the metrics may take a while.