Fig. 5.
Download original image
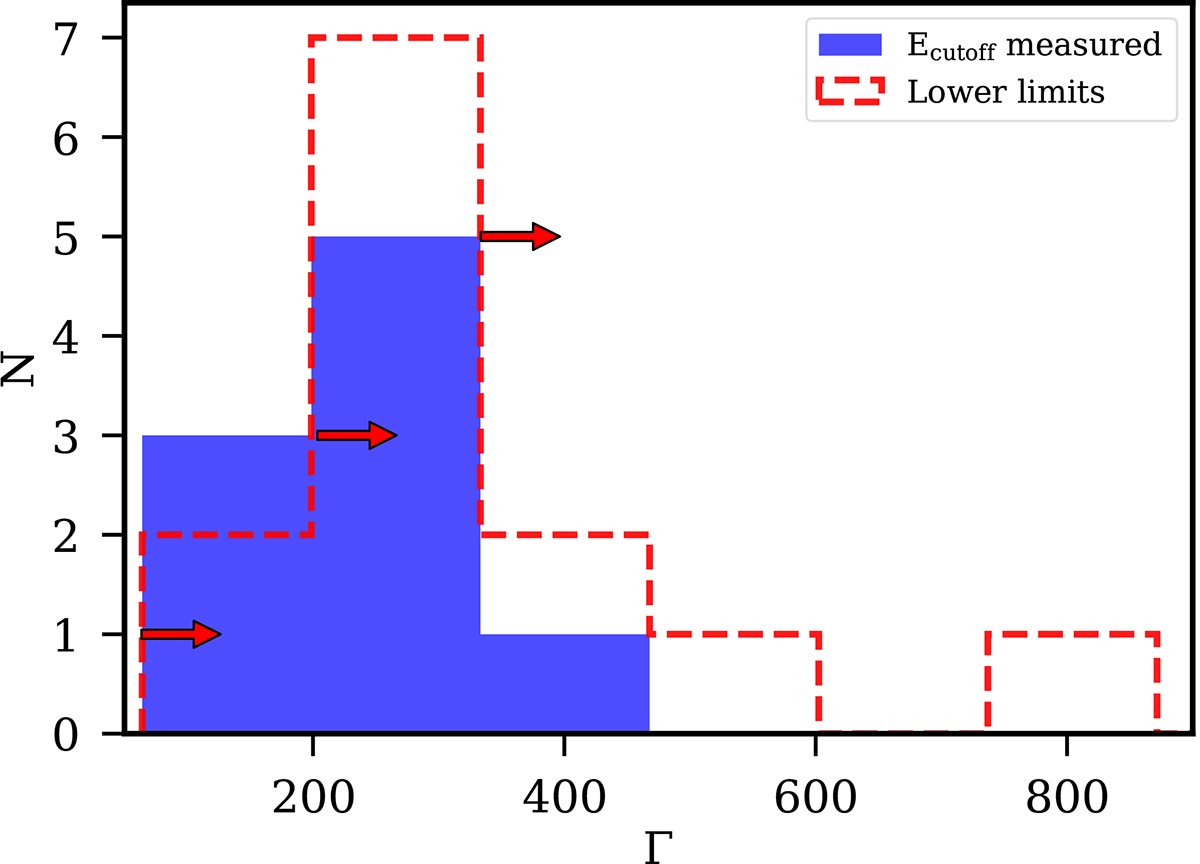
Distribution of bulk Lorentz factor Γ obtained from the spectral analysis of the 22 bright GRBs that were co-detected by GBM and LAT and considered for this work. The values of Γ are derived by interpreting the high-energy cutoff (either a measurement of or a lower-limit of) as a sign of pair-production opacity, following Eq. (7). The blue-filled histogram represents the measurement of Γ for the 9 GRBs of the sample showing evidence of high-energy cutoff in their prompt emission spectra. The dashed red histogram (with rightward arrows) represents the lower-limit on Γ from the 13 GRBs not showing a cutoff in their spectrum (see the text for details).
Current usage metrics show cumulative count of Article Views (full-text article views including HTML views, PDF and ePub downloads, according to the available data) and Abstracts Views on Vision4Press platform.
Data correspond to usage on the plateform after 2015. The current usage metrics is available 48-96 hours after online publication and is updated daily on week days.
Initial download of the metrics may take a while.