Fig. 4.
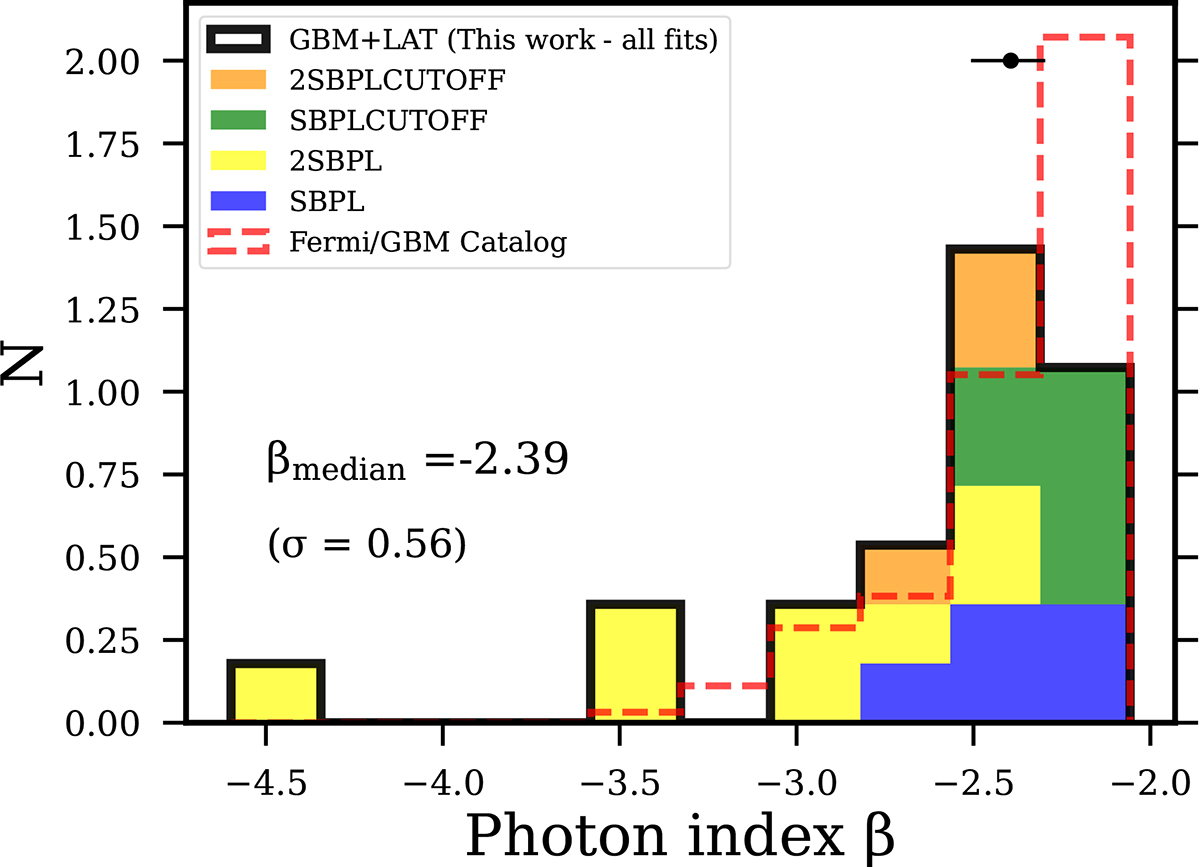
Download original image
Distributions of the high-energy slope β (photon index) for the 22 GRBs’ spectra analyzed. The different best-fitting models are represented by different colors (stacked on top of each other), while the black empty histogram represents the total distribution of β values derived from the spectral fits performed in this work. On the top of the distributions it is over-plotted the median value and the mean error on the β parameter for the whole sample. For comparison, the distribution of the β values derived from the Fermi/GBM catalog is represented by the red dashed histogram. The distributions have been normalized to the respective sample size.
Current usage metrics show cumulative count of Article Views (full-text article views including HTML views, PDF and ePub downloads, according to the available data) and Abstracts Views on Vision4Press platform.
Data correspond to usage on the plateform after 2015. The current usage metrics is available 48-96 hours after online publication and is updated daily on week days.
Initial download of the metrics may take a while.