Fig. 3.
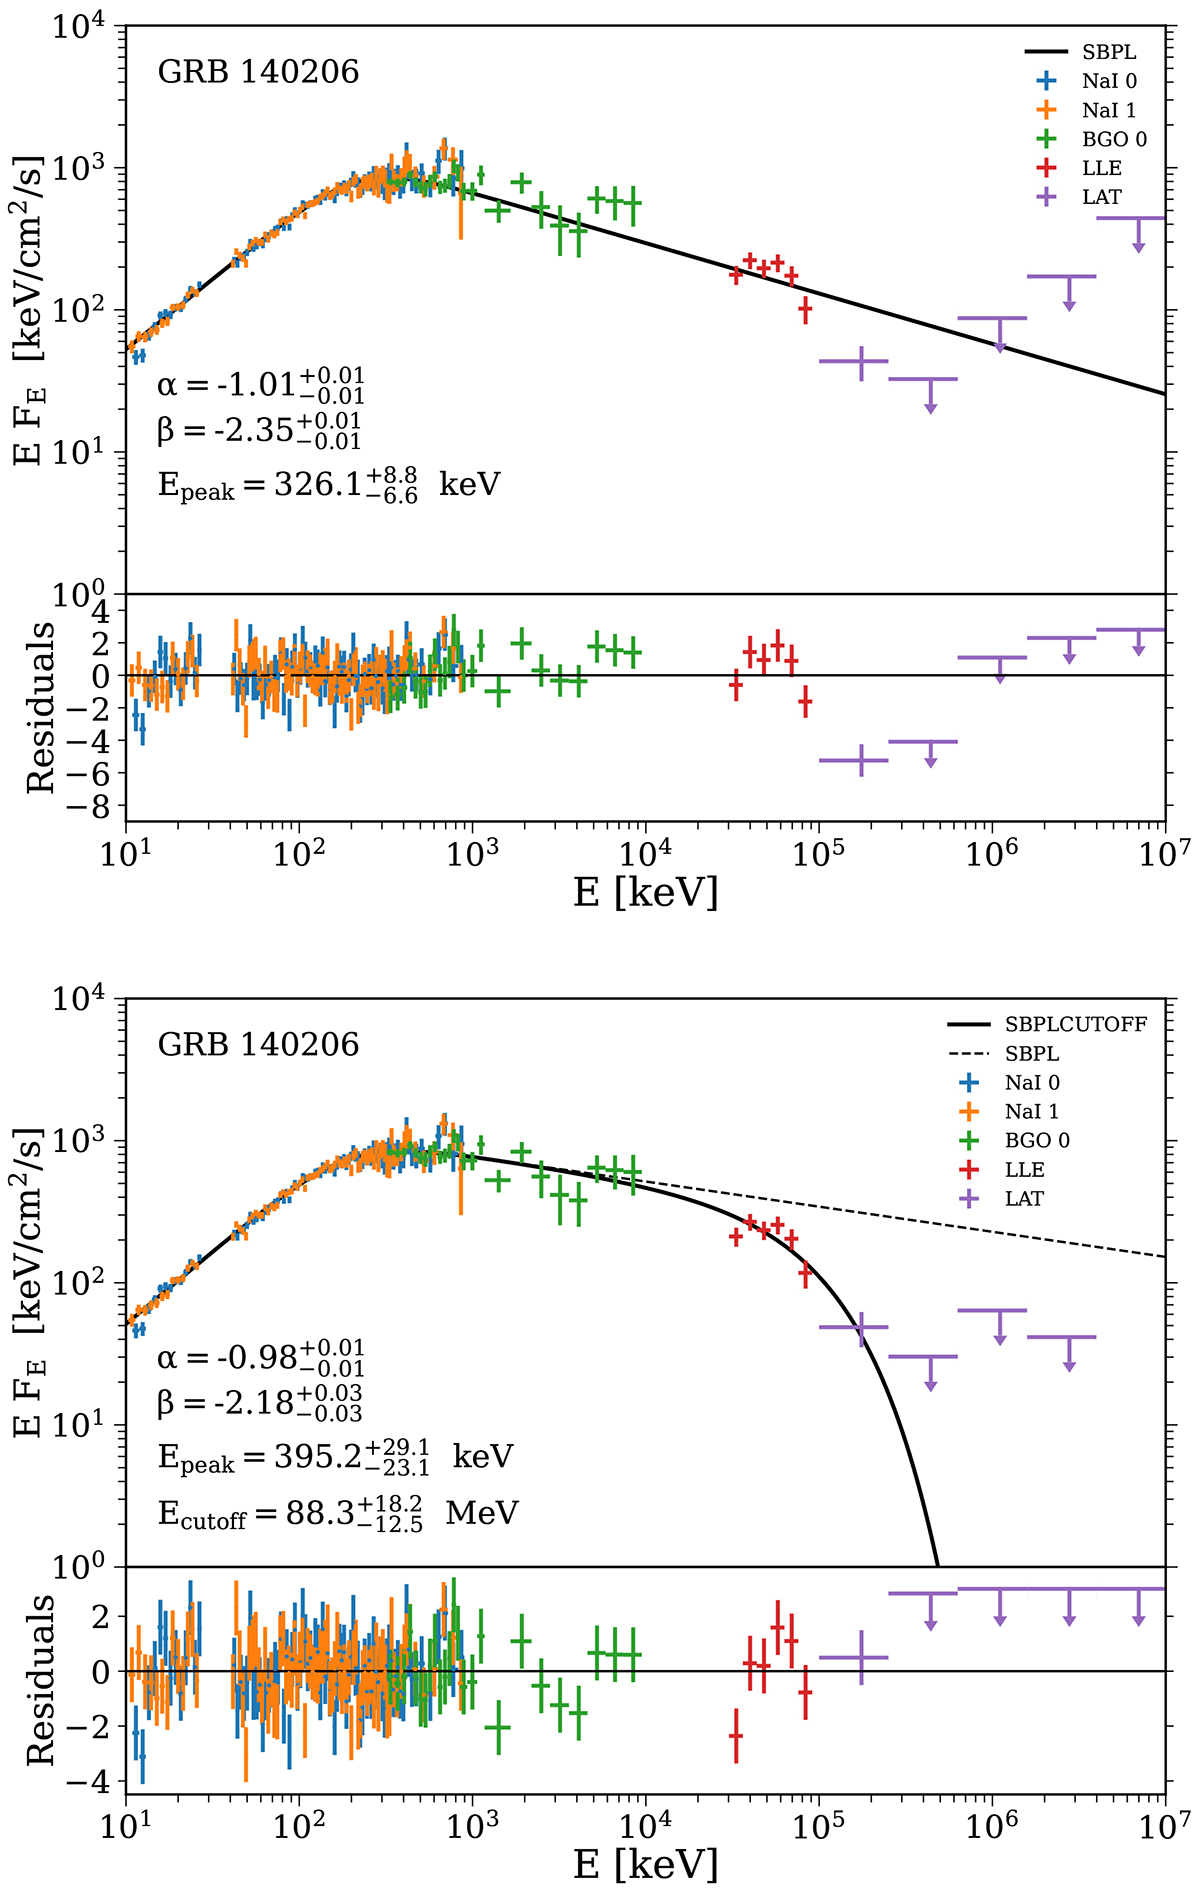
Download original image
Example of a time-integrated spectrum showing a cutoff at high energy. Data correspond to the signal detected by different instruments (color-coded as shown in the legend) for GRB 140206. The top plot shows the fit with the SBPL function, represented by the solid black line. The bottom plot shows the same spectral data fitted with the addition of an exponential cutoff, namely with the SBPLCUTOFF function, represented with the solid black line. The dashed black line displays the SBPL function without the exponential cutoff term. The parameters of the best-fitting models and their 1-σ errors are reported in each plot (see also Table 2). The bottom panel of each plot shows the residuals of the spectral fit (computed as the distance of the data from the model in units of the errors). Data have been rebinned for graphical purposes.
Current usage metrics show cumulative count of Article Views (full-text article views including HTML views, PDF and ePub downloads, according to the available data) and Abstracts Views on Vision4Press platform.
Data correspond to usage on the plateform after 2015. The current usage metrics is available 48-96 hours after online publication and is updated daily on week days.
Initial download of the metrics may take a while.