Fig. 2.
Download original image
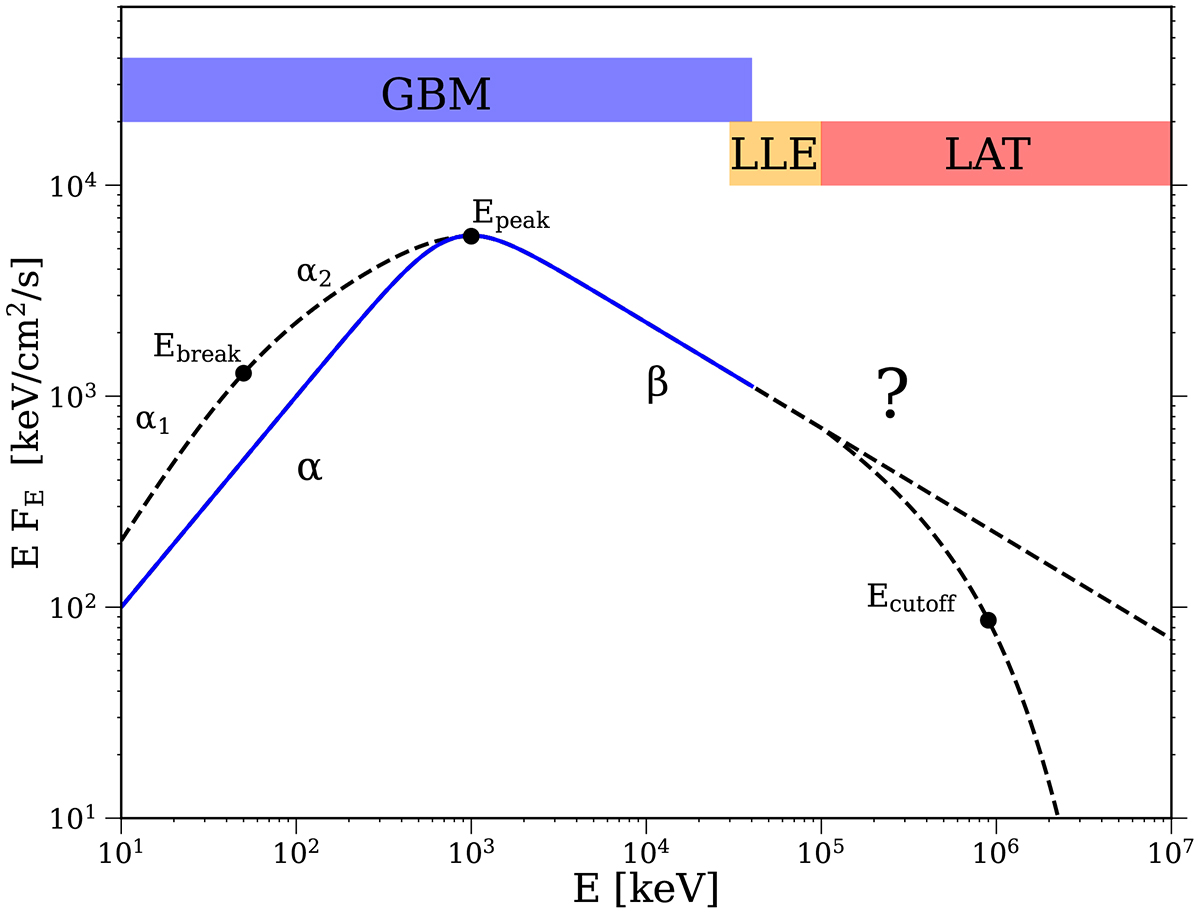
Representation of the four possible prompt emission spectral shapes and the corresponding spectral coverage of the GBM and the LAT instruments on board Fermi tested in this work, spanning 6 decades in energy. The typical GRBs spectrum is shown with the blue solid line, characterized by the usual α, β and Epeak parameters. Below the peak energy, the dashed black line shows the possible presence of a spectral break, modeled with the additional parameters α1, α2 and Ebreak (as shown in Ravasio et al. 2018, 2019). At higher energies, above Epeak, the spectrum could show either the presence of an exponential cutoff, marked by Ecutoff, or the extension of the power-law with slope β (dashed black lines). The y-axis scale is arbitrary.
Current usage metrics show cumulative count of Article Views (full-text article views including HTML views, PDF and ePub downloads, according to the available data) and Abstracts Views on Vision4Press platform.
Data correspond to usage on the plateform after 2015. The current usage metrics is available 48-96 hours after online publication and is updated daily on week days.
Initial download of the metrics may take a while.