Open Access
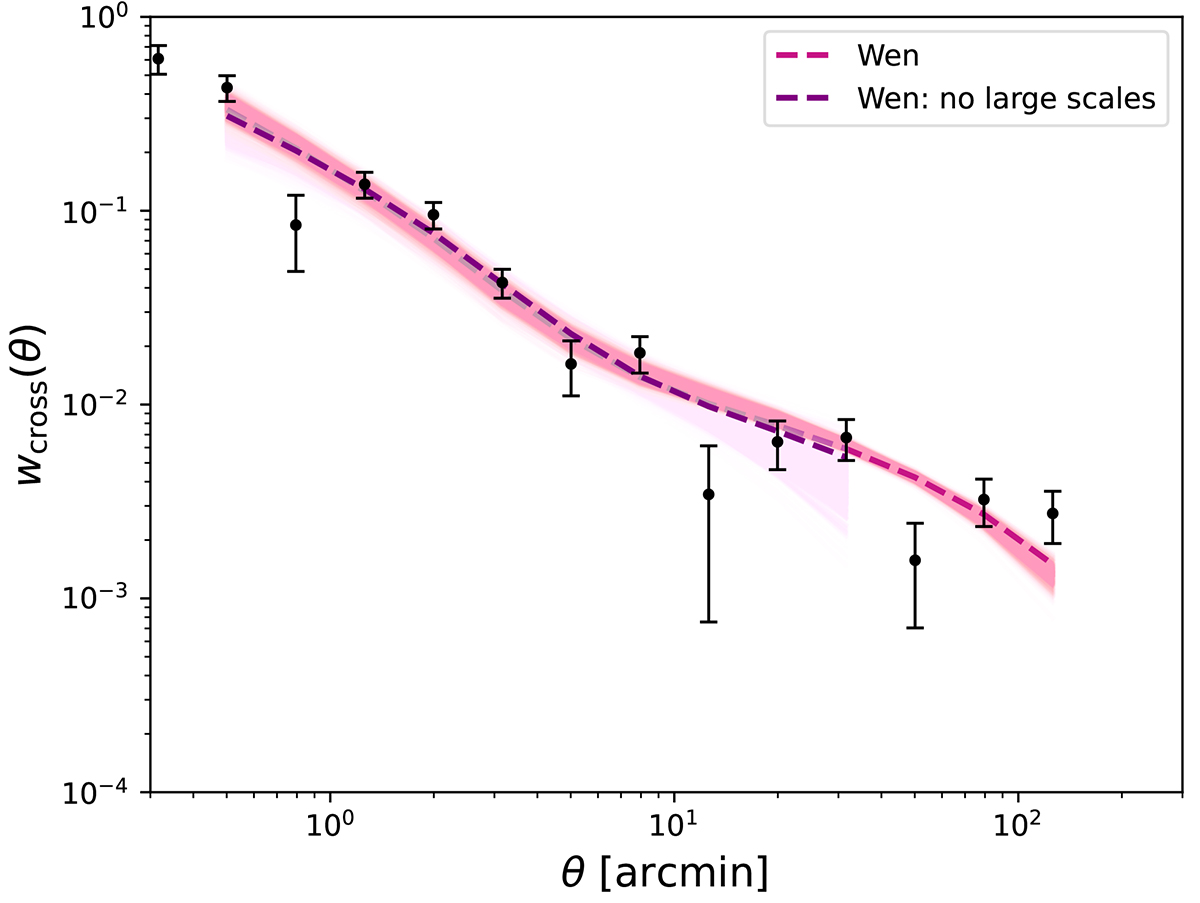
Fig. 9.
Download original image
Sampling plots for WEN using all points and excluding large-scale data. The pink and purple regions denote all data points and the excluded large-scale measurements, respectively. The dashed lines depict the best-fit results, and the data are represented by black dots.
Current usage metrics show cumulative count of Article Views (full-text article views including HTML views, PDF and ePub downloads, according to the available data) and Abstracts Views on Vision4Press platform.
Data correspond to usage on the plateform after 2015. The current usage metrics is available 48-96 hours after online publication and is updated daily on week days.
Initial download of the metrics may take a while.