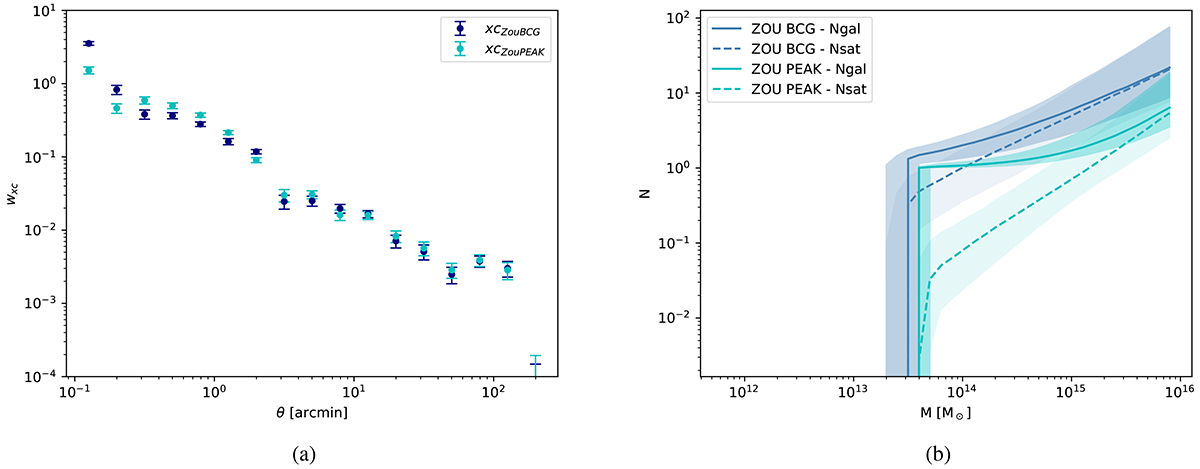
Fig. 8.
Download original image
Left: cross-correlation data obtained for the ZOU cluster with BCG positions (dark blue) and PEAK positions (light blue). Right: sampling plot illustrating the relationship between the total number of galaxies (Ncen + Nsat, solid line) or the number of satellites (Nsat, dashed line) and the halo mass (M) based on the HOD model for the ZOU cluster. Dark blue represents data obtained with BCG positions, while light blue represents data obtained with PEAK positions. The solid and dashed lines depict the sampling median for the number of galaxies and satellites, respectively, and the shaded regions indicate the 68% confidence interval. Large-scale data were excluded in this particular analysis.
Current usage metrics show cumulative count of Article Views (full-text article views including HTML views, PDF and ePub downloads, according to the available data) and Abstracts Views on Vision4Press platform.
Data correspond to usage on the plateform after 2015. The current usage metrics is available 48-96 hours after online publication and is updated daily on week days.
Initial download of the metrics may take a while.